This morning’s shocker: US Q4 GDP contracted. It turns out that the US is not an island on its own and is not decoupling from the global downturn which accelerated in most economies in 2012.
But not to worry, no doubt the consensus view that has been declaring great value in US stocks at 5 year highs, will be quick to dismiss this as an anomaly, rather than a trend. Stand by.
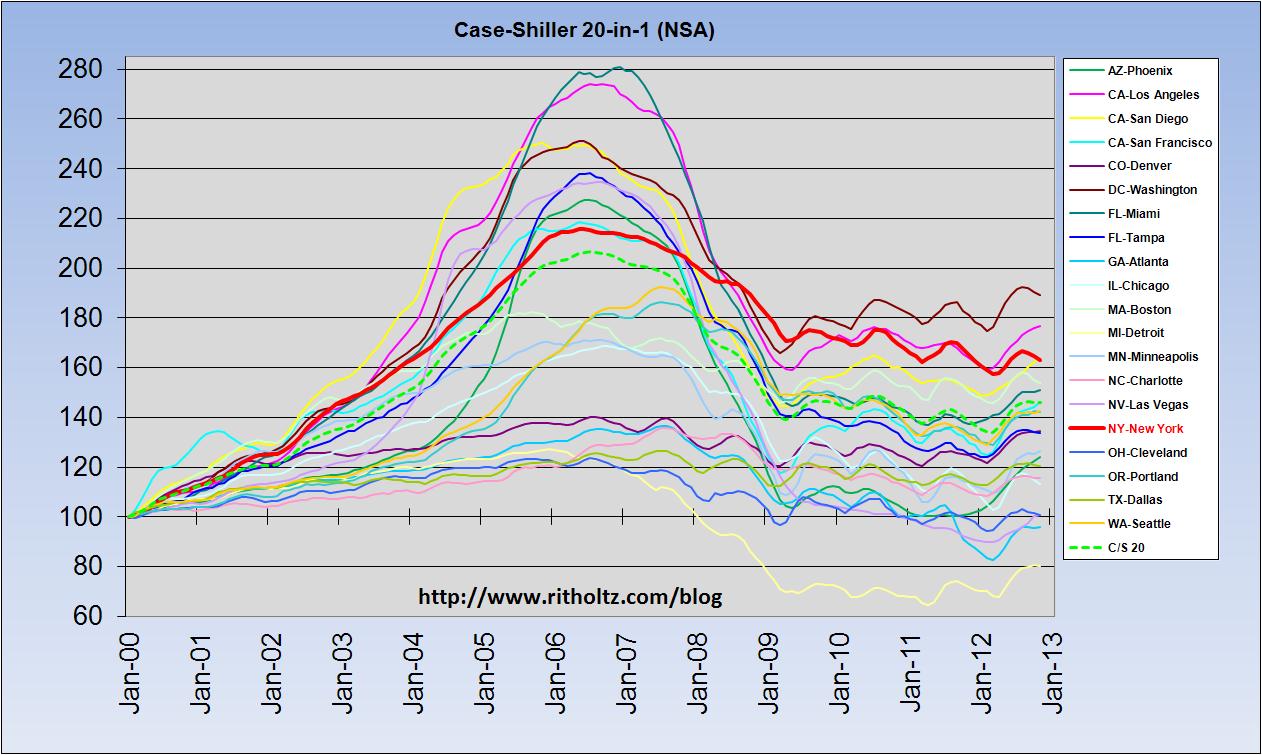
For those who don’t like to lose money, the Case-Shiller housing index offers some valuable insight on the way in which asset bubbles historically move. Here is a chart that includes the most recent data on the 20 city composite of home prices released yesterday.
Note the parabolic shape of prices into the bubble peak in 2006, followed by the collapse and then sideways action ever since as market forces battle to reprice and absorb excess inventory into the pool of able and willing buyers.
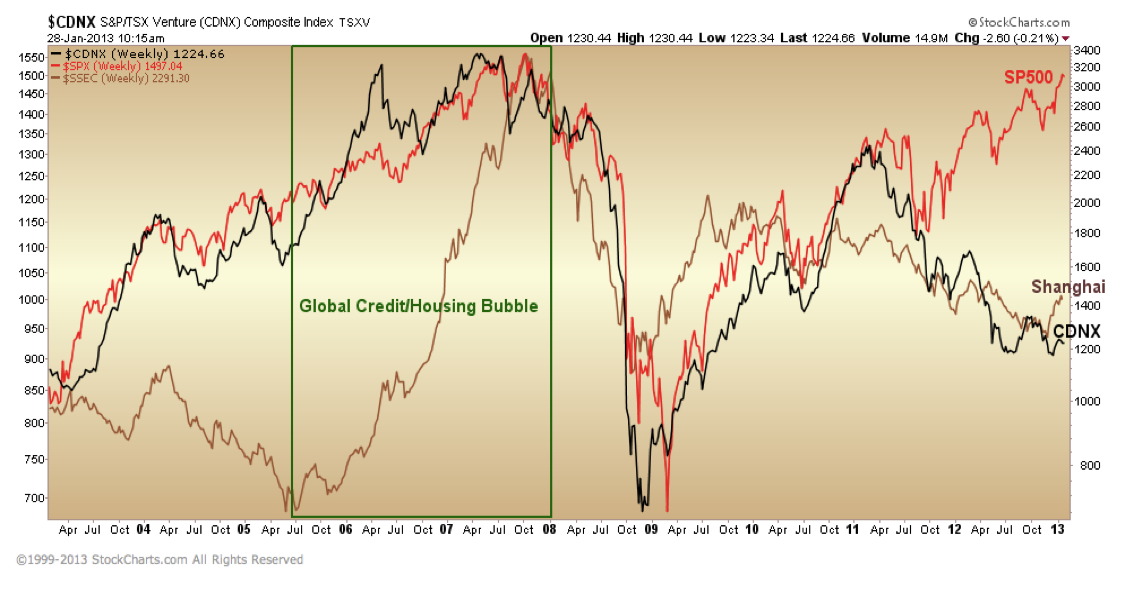
In fact this pattern is typical of financial bubbles and their aftermath. The secular bear periods that follow a valuation bubble take an average of 17 years to grind out the bubble excesses and finally present exceptional investment value. We saw a similar pattern in stock markets after 1929 and pretty much every other secular bear period that followed every secular market top in history. This includes most recent examples of Japanese real estate and stocks since 1989, and technology stocks since 1999. In 2000, broad stock markets also began the necessary process down from their bubble peak. But over the past couple of years, this natural correcting process have been stalled in a detour of government bailouts that have temporarily supported insolvent institutions and by central banks tinkering in experiments of monetary theory. 13 years into the present secular bear in stocks we see historically familiar trends playing out in Chinese stock prices as well as commodity and resource shares since they peaked with the credit bubble in 2008. Combined on one chart, we can also get a sense of the dramatic price risk now teetering over unsuspecting crowds in overbought US stock markets.

Source: Cory Venable, CMT, Venable Park Investment Counsel Inc.


Ref.: bubble stages/shape.
Understanding. Economic Bubbles. 2011. Author: Álvaro Jiménez Jiménez
http://www.eco.uab.es/ue/tfc%2061%20Jim%C3%A9nez%201.pdf
See fig. 1.9, p. 16.
Well, there is a lot of new home building in my neighborhoods west of Chicago. Lots of them actually, and lots of properties coming back onto the market. Hopium? Living in Illinois, BBB bond junkland, skyrocketing real estate tax bills with pensions written into Illinios constitution as law PLUS ObamaCare coming, I would certainly think long and hard if I wanted to take the plunge here. Actually, if I get a good offer, I’m out.
Many creditable outspoken experts who were bearish about the stock market now become somewhat bullish and admitted their were wrong about their bearish view. Some of them got back into equities in Jan this year such as Michael Don’t Fight the Fed but Its Monetary Policy is Wrong: Michael Pento
http://finance.yahoo.com/blogs/daily-ticker/
Biderman in the video below talking about he just found out that the Fed prints $4 billion each money and those money got into the stock market and that’s why stock market keeps going higher and higher no matter what. And this an ongoing money printing process by the Fed is why stock market will blow the lid off soon. What do you think about it?
Biderman’s Daily Edge: ed Creating $4 Billion in New Money Each Day Helping to Rig Stock Market http://www.youtube.com/watch?v=KOfXkt8Kezc
Ms Parker, would you please talk about this in your next talk show? Can’t wait to hear from you because you are one of the few voices that speaks to me.
Pingback: Stocks at cycle highs while US economy contracts in Q4 | Juggling Dynamite « The Affluent Boomer™
Could you please tell me the last time you where long the stock market? As far as I can tell you have missed the entire move from the 2008/2209 lows.
Quite untrue. We bought broad markets last in the Spring of 2009 and sold into strength in 2010. We were out in 2011 and 2012. Overall we have outperformed the perpetually invested crowd with positive annual gains (including in 2008) and a fraction of the capital risk since inception.
My theory is that US Q4 GDP fell because Obama covertly ordered every cent of descretionary Q4 defence spending to be spent in Q3 … so that Q3 GDP would look good for the election.
It’s all about politics all of the time … except when it’s about money.,