
Today the US 10 year treasury has dropped to 2.5%, down from a yield of 3% at the start of the year. If it does close through 2.50 the next downside test area is 2.3% as shown in this updated chart.

Of course throughout, as usual, stock-floggers have been perpetually forecasting treasury bond prices would tank and 10 year yields soar to 4%+ every moment now. Fascinating that they always see rates moving higher for investment grade bonds (prices lower), but never the commensurate repricing lower that deflation would imply for risk assets like corporate bonds and equities.
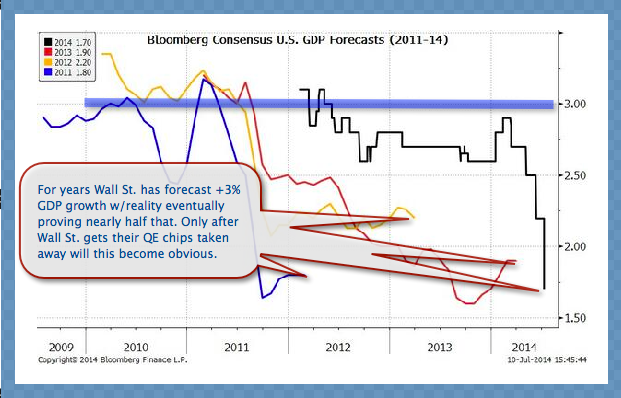
But then they are stock-floggers after all, and so hope springs eternal on their asset class and future growth. Most especially as prices move to all time highs. This next chart of consensus GDP forecasts since the start of every new year since 2009 offers some perspective. The consensus led by the inept US Fed has forecast US GP growth of 3%+ every year only to ratchet it down in retrospect every disappointing quarter. 2014 has been no different (black line below), with expectations from near 3% in January now down to maybe 1.5% half way through.
For those who remain mystified as to how North American bonds could be still attracting large buyer interest at present yields, this chart from Hoisington Investment Management, second quarter review and Bloomberg offers a comparative view of present US and Canadian government bond yields relative to the rest of the developed world. So far, North American bonds are offering the highest yields by a significant margin.

How low can North American treasury yields go? If the slowing global growth theme continues as we suspect it will over at least the next year or two, the answer is quite a lot lower, with the US 10 year potentially moving back below 2% and the 30 year well below 3. Believe it or not.
