
Risk-sellers are unanimously agreed: equities are good at every valuation. The question the rest of us must always ask is: good for whom?
Shown here since 1900, valuations for S&P 500 stocks today have rarely been more expensive (less attractive) but for a few short months in 1999 and 1929.
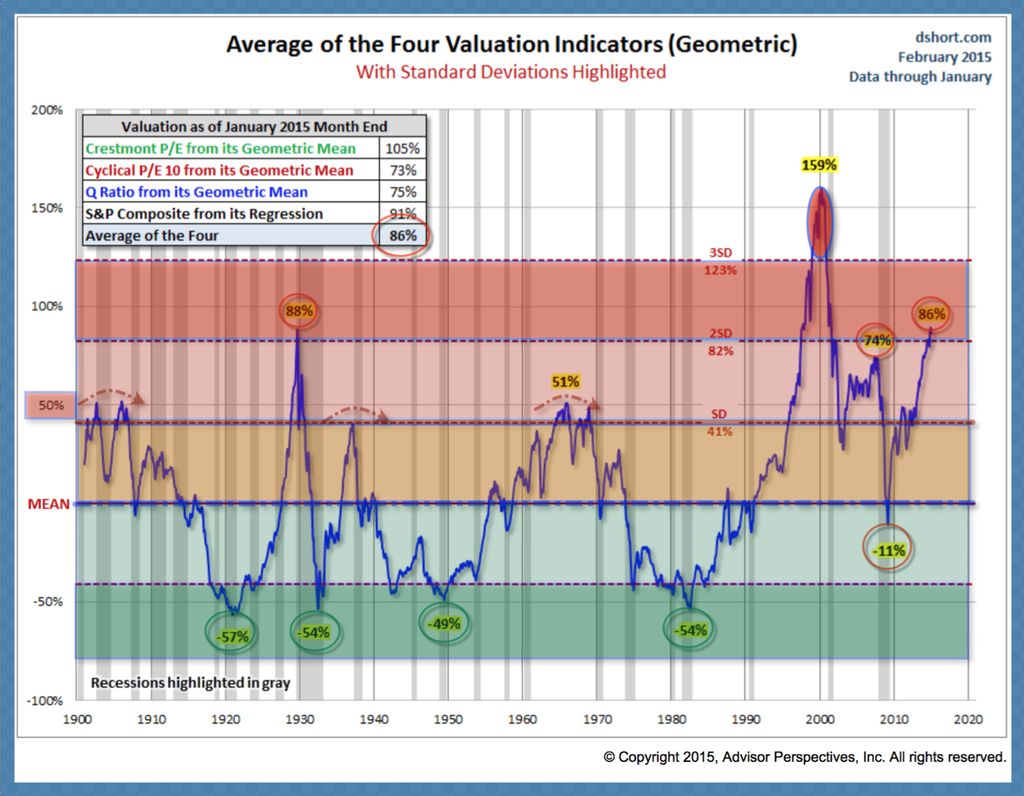 Chart source Doug Short offers some perspective:
“The latest P/10 valuation is 27.0 at a -0.09% year-over-year inflation rate, which is below the sweet spot mentioned above.
And speaking of that 30 threshold for the P/E10, prior to the Tech Bubble, only two months in history had a ratio above 30: They were 31.5 and 32.6 in August and September of 1929, just before the Crash of 1929. Research estimates put the annual inflation rate during those two months at 1.17% and 0.00% (zero).
In the months following the Great Financial Crisis we have essentially been in “uncharted” territory. Never in history have we had 20+ P/E10 ratios with yields below 2.5%. As I type this, latest monthly average of daily closes on the 10-year yield is at 1.97%, which is not much higher than its all-time average of 1.53% in July 2012. The closest we ever came to this in US history was a seven-month period from October 1936 to April 1937. During that timeframe the 10-year yield averaged 2.67%. How did the market fare? The S&P Composite hit an interim high (based on monthly averages of daily closes) in February 1937. The index plunged 44.9% over the next 15 months.
If we look to the Dow daily closes during that period, the index hit an interim high on March 3, 1937 and fell 49.1% to an interim trough on March 31, 1938 — 13 months later.
Further, as we ponder the historical context of present valuations, let us not forget that some 50% of S&P earnings come from sales outside of the US–sales that are falling in value with each week that the US dollar moves higher….(And that’s not counting the crash in energy prices which as aforementioned is yet to be fully accounted for).
As I was explaining here in February 2008 (8:20 on the playbar), it’s not just a high numerator “price” that makes rich P/E ratios so dangerous to capital…try evaporating the “E” (earnings) denominator dramatically and then recheck the (greater fool) multiple paid.
