
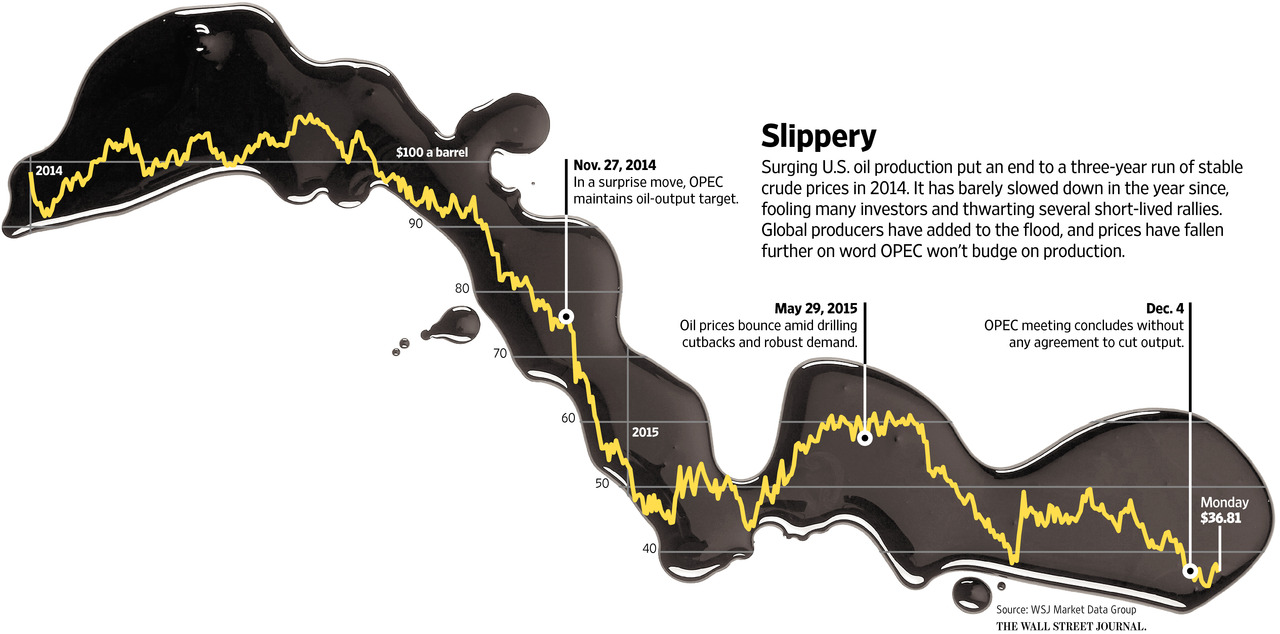
Very few saw it coming, but today everyone knows what happened to oil prices over the past year. This graphic from the Wall Street Journal captures the relentless price tsunami which has been hammering so many investors, companies and countries over the last 12 months.
As always, the financially critical question is what happens from here?
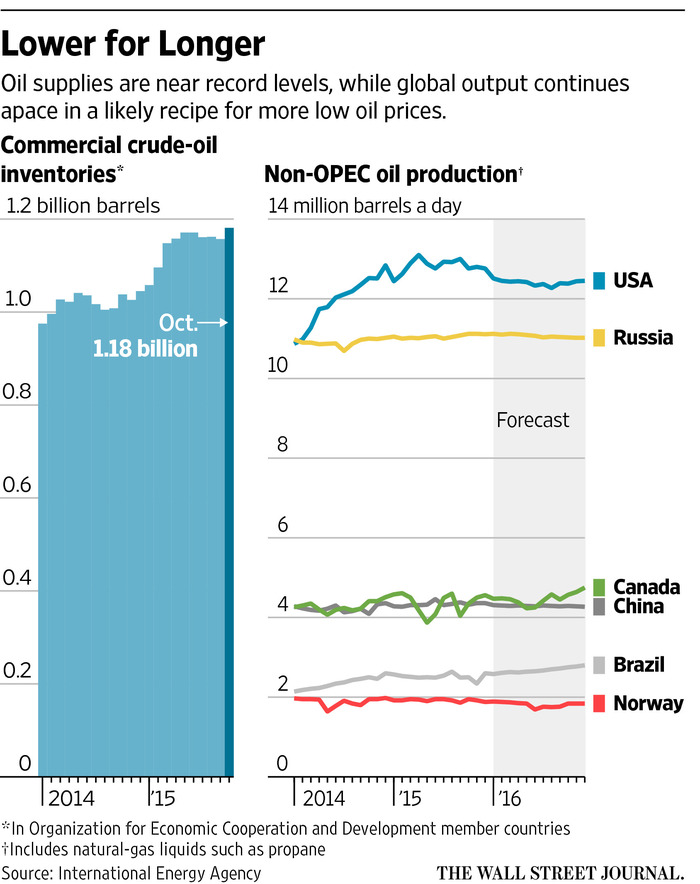 To postulate it is important to note that oil production and inventories have increased, not fallen with prices, as so many had predicted.
Second it is essential to comprehend just how indebted and cash-strapped the price collapse has left many unprepared producers and related service providers. The net effect of high debt and plunging income is an increasing desperation for cash flow to cover expenses. Those in weak financial circumstances are in no position to strategically game output. To the contrary, they are likely to pump even more superfluous product as prices plunge.
With growth recessing all around the world, and alternative energies booming, oil demand is not likely to soak up excess supply quickly. In response the US is moving to export and the Saudis are slashing budgets and hunkering down for a long haul. 2016 is unlikely to be kind to the many companies and governments that have factored in a presumption of crude above $50 a barrel. See: Not even OPEC can fix oil glut.
And yet, today under $37, the probability of even lower prices from here must be acknowledged. In fact charted here since 1982, the 2005-2015 decade of crude above $40 a barrel (brown band) was an anomaly caused by the banker-stoked global credit bubble. Now that the whole world is in the debt hangover phase , crude in the $20’s (green band) is entirely reasonable–it might even be dear.

