
As the market awaits the next Baker Hughes rig count to be released at 1 p.m E.T. today, a few big picture charts on oil offer a heads up. See: Why Sub $50 oil is more likely than $70 oil.
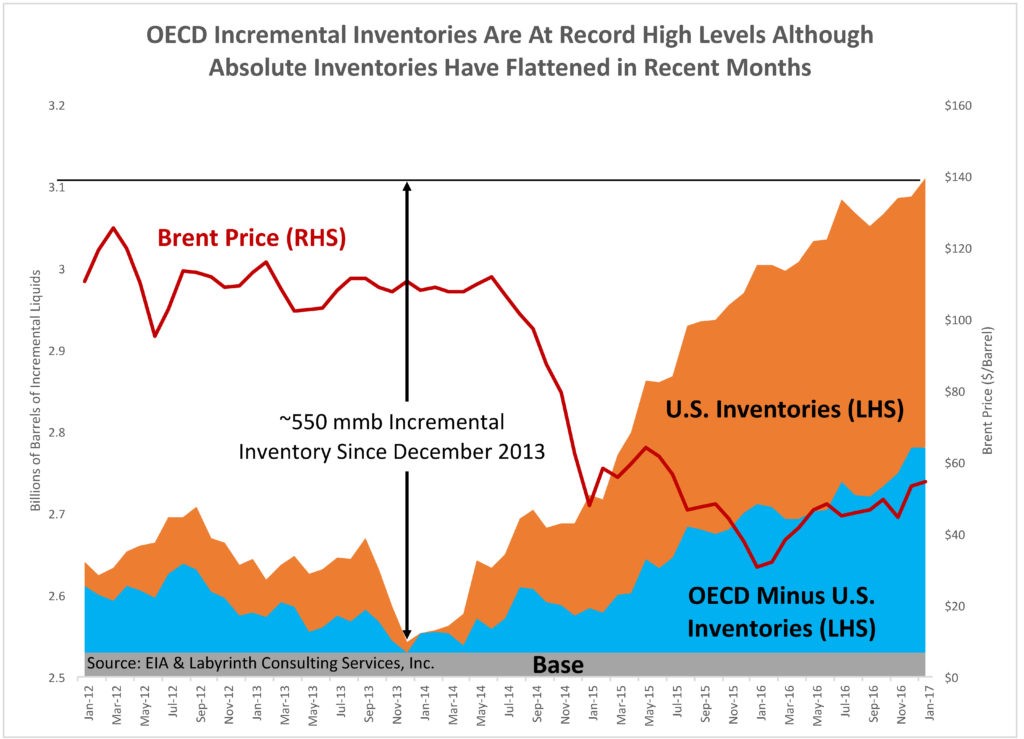
Since the OPEC cut deal last September, crude prices have moved back above $50 a barrel and incentive to produce has naturally moved higher with them. This has attracted even more hopeful capital into the space, and led to yet another wave of over-investment. In the US alone, 130 additional horizontal rigs have been brought on stream since last fall, taking U.S. crude inventories to new record highs. Last week 13.8 million barrels were added to U.S. storage–the second largest in history. And it’s not just America, OECD inventories and are now more than 400 million barrels above the 5-year average (charted here since 2012).
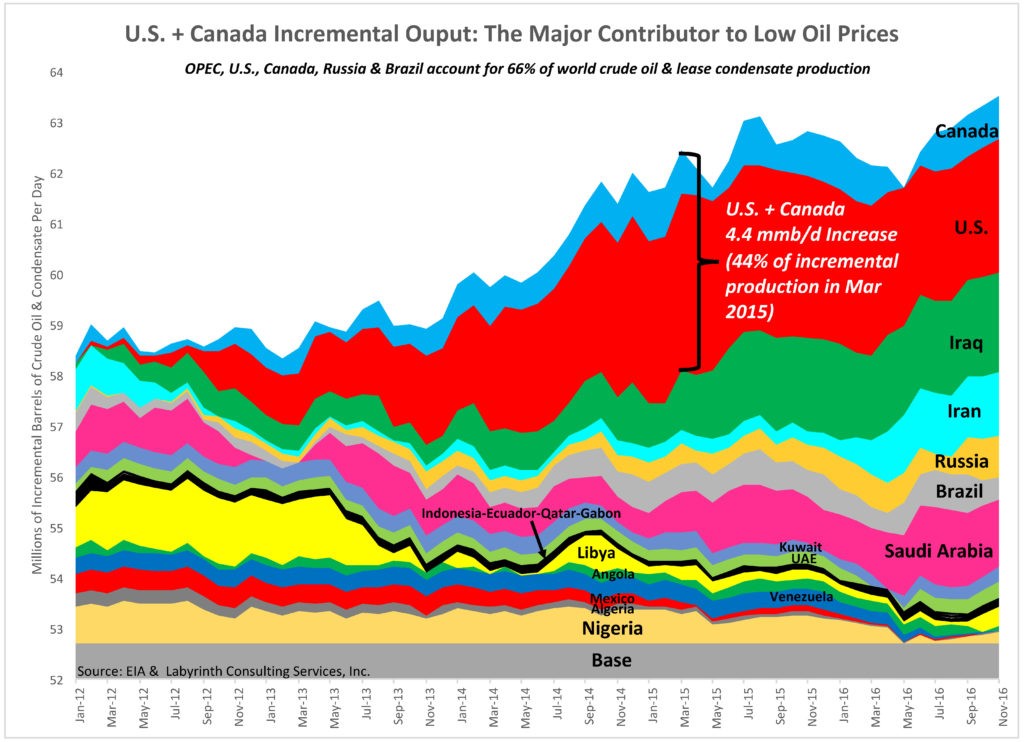
 As shown below, over-production by the U.S. and Canada has been most prominent.
 What about all those momentum trading algos and bullish speculators?
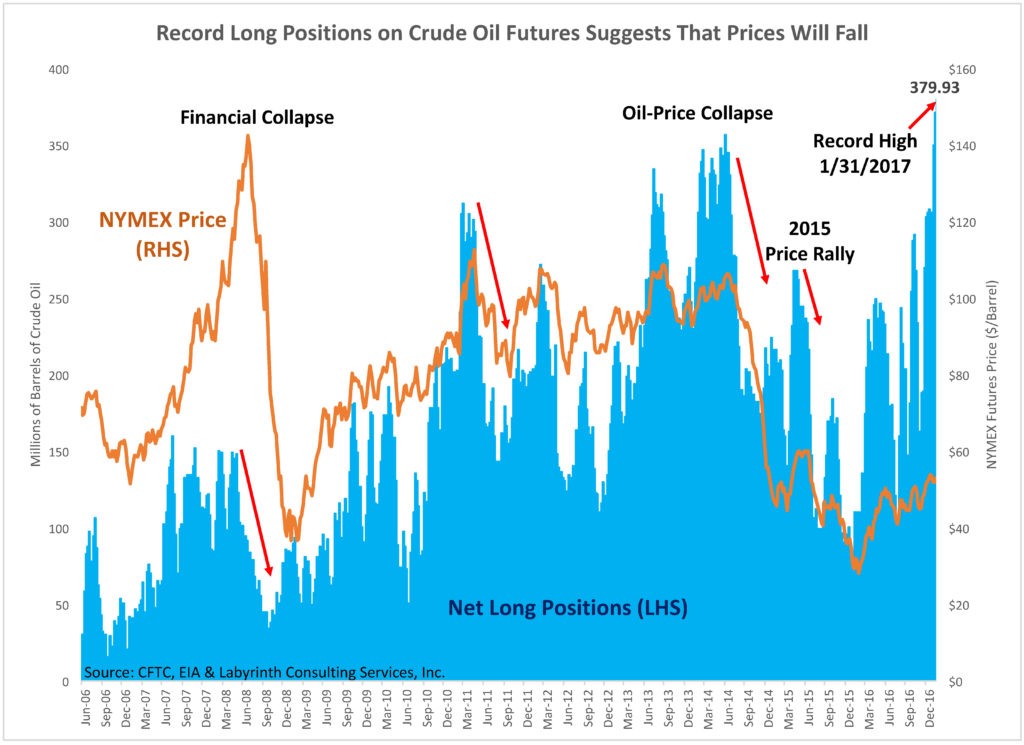
A recent Wall Street Journal article noted a new record in long crude oil futures positions during the last week in January. It went on to speculate that this meant a possible end to the over-supply of oil and that prices should increase.
That observation is not supported by history. In fact, record long positions are commonly followed by a drop in oil prices. Notable examples shown in Figure 8 include price declines around the 2008 Financial Collapse, the 2014 world oil-price collapse, and the brief rally to $60 prices in the Spring of 2015.
 Meanwhile the move away from fossil fuels is only getting started. This week, Pueblo, Colorado and Moab, Utah became the 22nd and 23rd cities in the U.S. to commit to transition to 100% clean, renewable energy. No matter who is in the White House, or what words they ban from text books and federal government websites, the renewable energy evolution is here to stay, and will keep steadily eroding oil demand.
