Every year the Berkshire Hathaway annual meeting brings a circus of media coverage along the lines of “why Warren Buffett is bullish [always] on America”. As I have pointed out before, part of this is because 55+ years of longevity and a high profile with billions in cash reserves have allowed Berkshire to be a lender of last resort that is able to extract sweeter yields and products than going rates. But also because as a major shareholder in publicly traded companies, Berkshire has necessarily become a long-always fund, unable to easily sell or downsize its positions.
On a personal level, Buffett and his partners are some of the world’s wealthiest billionaires with excellent cash flow who are now more concerned with legacy and tax planning issues than with the standard income and capital preservation needs of mere mortals. However, for those who are buying bullish statements from Berkshire and company, a look at its stock price (not the internal book value Buffett likes to talk about) is reflective of the real life investor experience over the past 10 years of our secular bear in stocks.

Like the S&P 500, after dropping more than 50% in 2009, Berkshire is now just slightly above the high it reached at the last cycle peak in 2007. Most important at this point however, is not that those who held on have just recently managed to recover the capital they lost 5 long years ago, but what is likely to happen to that capital in the next market downturn.
For an indication, we see warnings in a host of reliable valuation tools today. But it is instructive here to look at US stocks with the Oracle of Omaha’s very own stated favorite market valuation metric: “the market value of all publicly traded securities as a percentage of the country’s business–that is, as a percentage of GNP.” Here he is explaining in a 2001 interview with Fortune’s Carol Loomis:
“The tour we’ve taken through the last century proves that market irrationality of an extreme kind periodically erupts–and compellingly suggests that investors wanting to do well had better learn how to deal with the next outbreak. What’s needed is an antidote, and in my opinion that’s quantification. If you quantify, you won’t necessarily rise to brilliance, but neither will you sink into craziness.
On a macro basis, quantification doesn’t have to be complicated at all. Below is a chart, starting almost 80 years ago and really quite fundamental in what it says. The chart shows the market value of all publicly traded securities as a percentage of the country’s business–that is, as a percentage of GNP. The ratio has certain limitations in telling you what you need to know. Still, it is probably the best single measure of where valuations stand at any given moment. And as you can see, nearly two years ago the ratio rose to an unprecedented level. That should have been a very strong warning signal.”
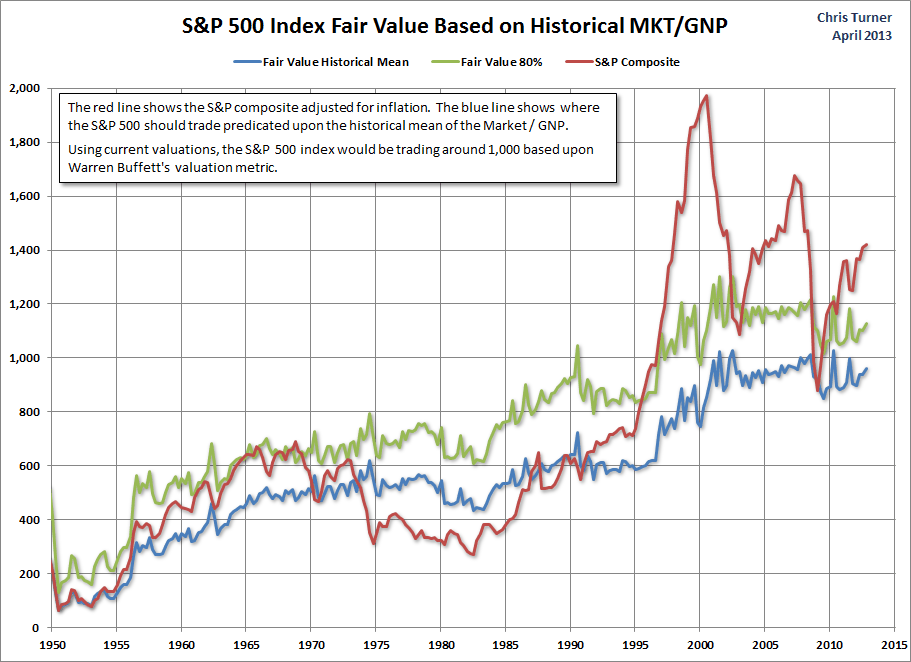
So taking Warren at his word, here is what his preferred valuation tool says about US stocks as a percentage of Gross National Product today:
As plotted by the green line, the S&P 500 should be trading at about 1000 today given present US GNP. So at its present 1616, the S&P 500 is about 38% over-valued. Nothing the next bear market can’t cure of course, but certainly an indicator of probable losses for US stock prices ahead.
US stocks offer good value today Warren? Really? Thanks for the tip.


