
I will be doing some travelling in June and taking a break from the blog. Best wishes, light and levity. Life goes by so quickly.
Follow


_________________________
Cory’s Chart Corner
Load More
I will be doing some travelling in June and taking a break from the blog. Best wishes, light and levity. Life goes by so quickly.
The financial sector profits most when people buy into inflation fears and the riskiest asset classes. It is important for those of us with capital to understand why the relentless risk-sales pitch is generally contrary to our best interests. Especially when we are at or within a decade of retirement.
As we explain in our May 31st client letter, bonds are the only asset that comes with a promise to pay a contractually prescribed income and return of principal on a defined future date. Nothing else, from stocks to commodities, crypto to real estate, comes with any such assurances. And yet, the masses are constantly told that bonds are for dummies.
The discussion below is far-reaching, relevant, and contrary to mainstream propaganda. Worth the listen.
Is the bond market really warning of a U.S. debt crisis — or are investors misreading a distorted market signal? Michael Green, Chief Strategist and Portfolio Manager at Simplify Asset Management, joins Maggie Lake to explain why passive investing, regulation, and hidden leverage may be warping the way markets price risk. He argues that what many see as a collapse warning in long-term bonds may actually be a mechanical consequence of how capital is being allocated. Green also breaks down why investors may be ignoring one of the clearest retirement opportunities in years, why liquidity is weakening beneath mega-cap stocks, and why he believes the “real craziness” in markets may still be ahead. 💡Michael Green warns that passive investing, hidden leverage, and distorted market signals may be leaving investors exposed to risks they don’t fully see. Here is a direct video link.
Deflating real estate bubbles have a message for those holding on to extreme valuations in other asset markets: mean reversion is inevitable and painful for the unaware.
New Zealand’s housing boom once looked unstoppable. Now prices are falling sharply, construction firms are collapsing and younger buyers are questioning whether property is still the safest path to wealth. On this week’s podcast, Chris Bourke speaks with Wellington Bureau Chief Ainsley Thomson about the economic fallout from one of the world’s biggest housing reversals — and what lessons it could hold for Australia as its own market begins to wobble. They discuss the painful reality of falling house prices, why governments fear housing downturns even when affordability is a political priority, and how New Zealand’s property slump is reshaping the way younger generations think about investing. Here is a direct audio link.
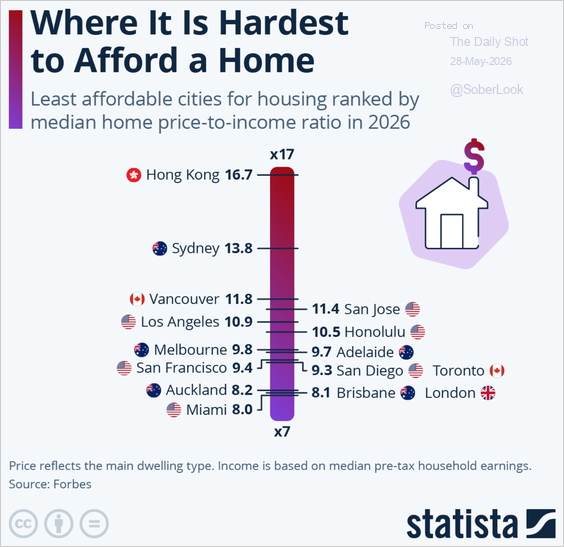
Home prices are still an irrational 8x plus multiple of household income in many key population centers today (as shown below). Long-standing affordability norms are no more than 4x. A lot more ‘correction’ is needed.
The segment below offers some real talk about the madness that passed as investing savvy in Canadian real estate over the last decade. Until the ‘easy money’ tide goes out, most have no idea how ill-advised and self-destructive their behaviours are. Revelations tend to spread as prices drop and losses compound.
The Shocking Contrast between A Professional Financial Advisor and A Real Estate Wealth Coach. How this lust for Real Estate Investment blew up after 2009 & has, for some people, ended in Tragedy today. Here is a direct video link.
Similar truths apply to the “financial advice” and investment management areas, where most people deal with risk-selling agents rather than risk-management fiduciaries. It’s often only when bubbles burst that reality dawns. By then it is usually too late.
Cory’s Chart Corner

