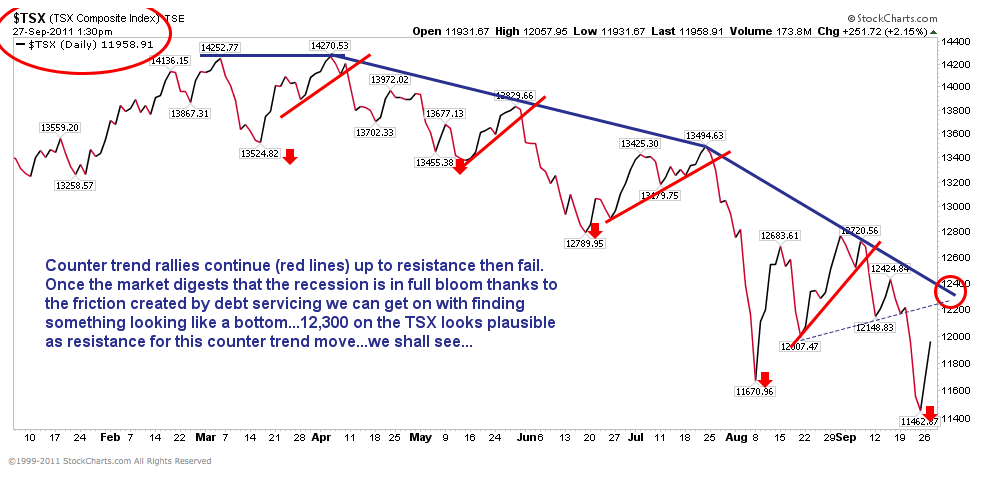
Source: Cory Venable, Market Technician, Venable Park Investment Counsel Inc.
Follow
____________________________
____________________________
Danielle’s Book
Media Reviews
“An explosive critique about the investment industry: provocative and well worth reading.”
Financial Post“Juggling Dynamite, #1 pick for best new books about money and markets.”
Money Sense“Park manages to not only explain finances well for the average person, she also manages to entertain and educate while cutting through the clutter of information she knows every investor faces.”
Toronto SunSubscribe
This Month
Archives
Log In


http://stockcharts.com/def/servlet/SharpChartv05.ServletDriver?chart=xiu.to,pluadanrbo%5Bpa%5D%5Bd%5D%5Bf1!3!0.10!!2!20]&pnf=y
http://stockcharts.com/def/servlet/SharpChartv05.ServletDriver?chart=hxu.to,pluadanrbo%5Bpa%5D%5Bd%5D%5Bf1!3!0.1!!2!20]&pnf=y
These Point and Figure Chart lines up very nicely with Cory’s chart. Buy a Put when an X prints just below or at the Bearish Resistance Line and sell on the first 3 Box Reversal into O’s.
I messed the last post up. The Sell is on the first 3 Box Reversal into X’s after a reversal into O’s. An X and an O. I guess it was too complicated
sell in may worked get ready to buy when it snows in november
canadian oil sands suncor petrobas exxon all priced almost like it was at the bottom of 2009 when oil was bottoming. Great dividends with those also. Oil may indeed go down a bit more but i cash dividends while I wait.
Hi Danielle,
You may want to post .jpg or .png images instead of .bmp….they load a lot quicker.