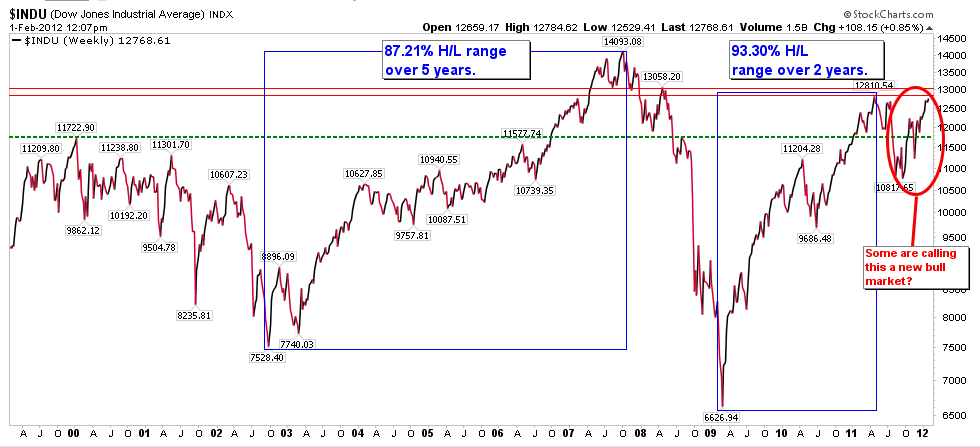
With the latest round of stimulus pump over the past few months, this time out of the European Central Bank, risk markets have lept up in another cyclical rally in our ongoing secular bear for stocks. This has led some to fall back in love with risk. This chart of the Dow’s trading range since this secular bear started in 2000 offers some clarity for those who wish to see.
 Source: Cory Venable, CMT, Venable Park Investment Counsel Inc.
This article is also a useful summary of where we are at today within our deleveraging- induced secular bear journey: See more: Secular Bear Market


Yes, very good clear analysis.
However, no mention of markets being propped up/rigged for the election in November..??
I suppose that we will just have to wait till then for the waterfall to start..??