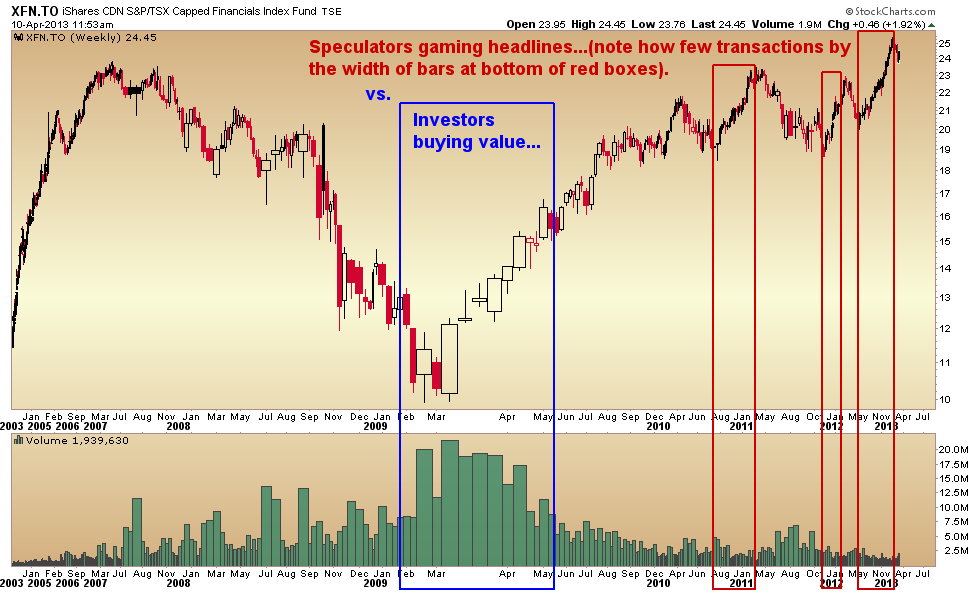
As the long always crowd assures us that this is a true secular bull market in stocks and that Central Bank pumping has put a new permanent put under asset prices, we just have one small question: if this is a true secular bull market where in the ‘h’ have all the buyers gone? Chart after chart reveals an absolutely freakish drop in investor participation over the past 3 years. A true bull market moves from disbelief at the outset as “smart money” buys in at the lows and most attractive valuations, followed by increasing belief as the cycle matures and the “dumb money” finally flows in late, buying the most near market tops as strong hands sell to weak.
The below chart of the Canadian financial sector captures the pattern we find in virtually all sectors and main stock indices today. Note at bottom of the chart the thick bars (volume) of transactions in 2009 off the bottom (green denoting higher prices on the day, red denotes lower prices on the day) versus the miniscule volume of transactions thereafter, falling to barely visible year to date in 2013. Volume is supposed to lead price. This vapid and still waning volume of willing participants is a historically ominous sign. Buyer and holders beware.

Chart source: Cory Venable, CMT, Venable Park Investment Counsel Inc.
Here is another example highlighting our broken stock market today, here is a chart of the Materials Sector ETF “XMA”. Again we see a similar evaporation of interest and belief, with transaction volumes over the past 4 years totaling the volume seen in just one year in 2007. Seems like all the suckers where sucked into the peak in 2007 and then there was no one left to buy but a few levered speculators who managed to push prices up again into 2011 trading amongst themselves. Since then no new blood has been found forcing levered players to begin eating themselves on margin calls. Bullish this trend is not.

Chart source: Cory Venable, CMT, Venable Park Investment Counsel Inc.


