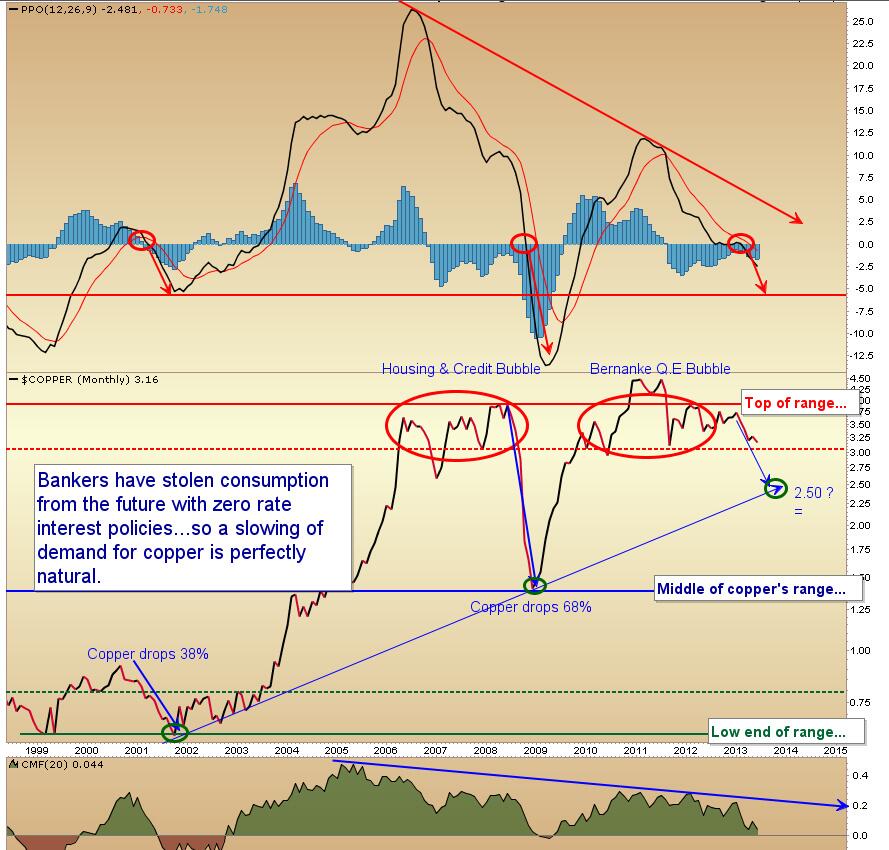
This long-term chart of copper reflects the leverage-fueled boom and busts since our secular bear began in 2000. The latest “QE bubble” for copper peaked in 2011 and since then Dr. copper has been beckoning still over-priced stock markets lower towards long-term support levels.
Source: Cory Venable, CMT, Venable Park Investment Counsel Inc.
Follow
____________________________
____________________________
Danielle’s Book
Media Reviews
“An explosive critique about the investment industry: provocative and well worth reading.”
Financial Post“Juggling Dynamite, #1 pick for best new books about money and markets.”
Money Sense“Park manages to not only explain finances well for the average person, she also manages to entertain and educate while cutting through the clutter of information she knows every investor faces.”
Toronto SunSubscribe
This Month
Archives
Log In


