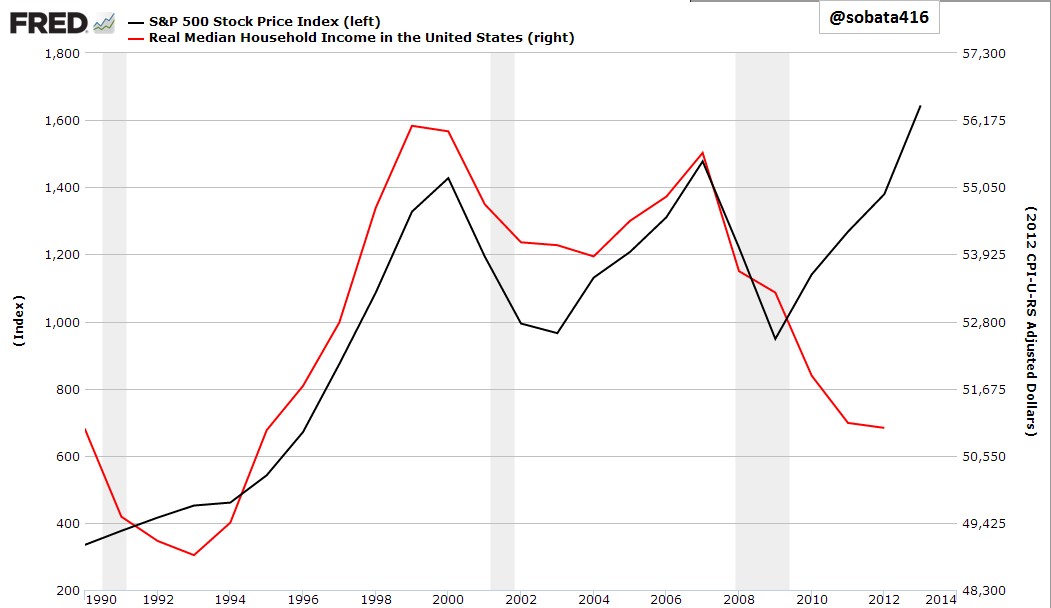
Surfing life savings over QE/HFT waves today may seem smart and proactive. But then again its also a fool’s paradise. Like Robert Redford’s character in All is Lost, equity market participants today are wading around on a sinking boat that can plunge at any moment. This chart capturing the glaring disconnect between US household incomes and the S&P over the past 4 years, as compared to the tight correlation 1990 to 2010, offers insight. A 50% fall in the S&P 500 would close the gap and restore historic correlations.

Follow
____________________________
____________________________
Danielle’s Book
Media Reviews
“An explosive critique about the investment industry: provocative and well worth reading.”
Financial Post“Juggling Dynamite, #1 pick for best new books about money and markets.”
Money Sense“Park manages to not only explain finances well for the average person, she also manages to entertain and educate while cutting through the clutter of information she knows every investor faces.”
Toronto SunSubscribe
This Month
Archives
Log In

