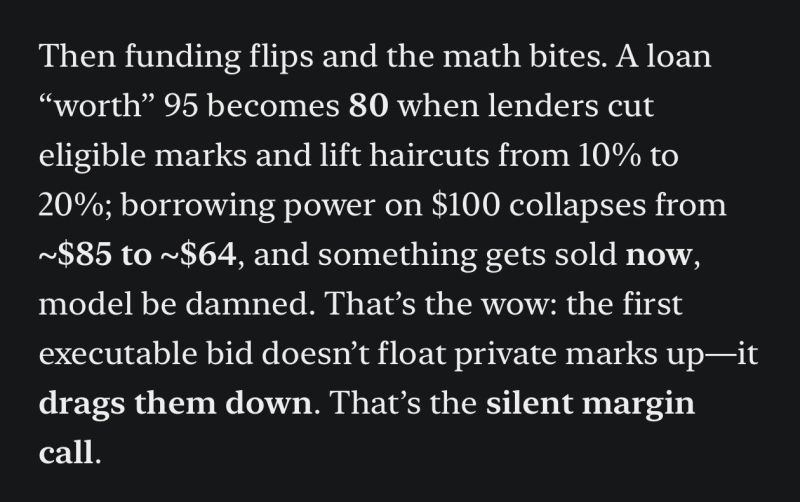
Another look at the bearish small cap divergence is found in the below chart, showing a ratio of the Russell 2000 small cap index over the S&P 500 index since 2006. Each time we saw this break down since 2010, the Fed raced to the rescue with another round of QE; this time they are tightening tapering, not adding more.
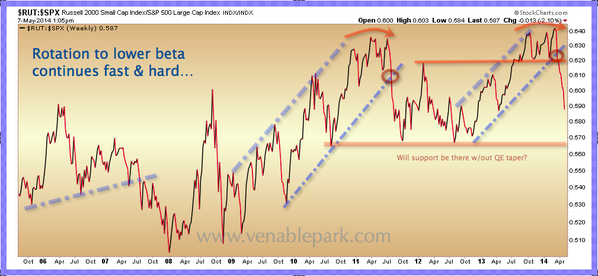
The 10 year Treasury yield is so far confirming the small cap vote for slower growth ahead.
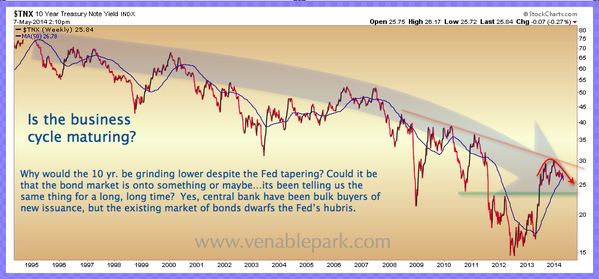
Sure HFT gamers don’t care about sales, income, jobs, economic growth or valuations, but alas, the real world must. The following chart courtesy of John Hussman shows that 49% of the Russell 2000 stocks have now entered a bear market with losses of 20% or more so far.
Follow


____________________________
Cory’s Chart Corner
Load More