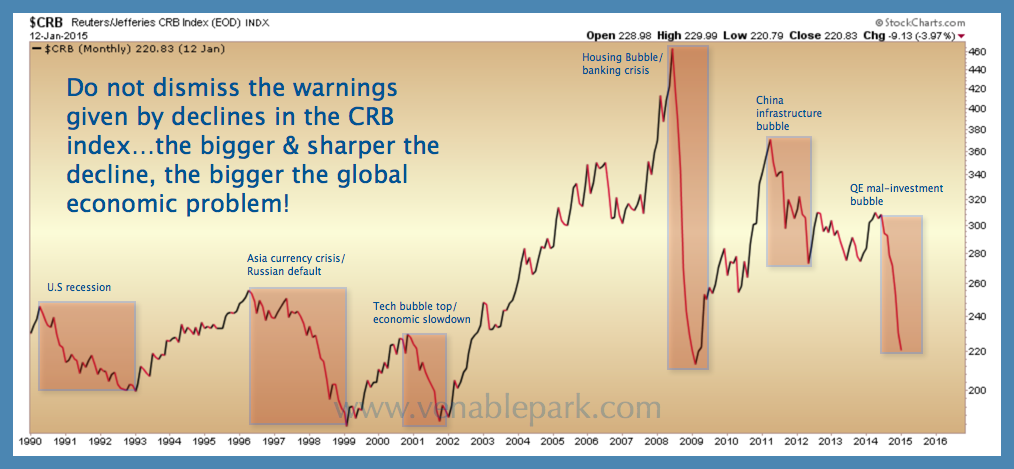
As Dr Copper ‘gave’ $2.60 a pound this afternoon–another day down more than 4% (-38% from its 2011 ‘stimulus’ rebound)–mean reversion that was, no doubt, slowed by future’s trading, hoarding and rigging, is finally underway. Commodities, of nearly every stripe, are re-coupling with the downturn in global growth.
This big picture chart of the Commodities Index (CRB) since 1990 offers some perspective on what large price declines in the world’s staples historically have signaled about the global economy and risk markets. Ignoring such signals has never been a wise strategy for growth and stock bulls in the past.


