The International Energy Agency forecasts that sluggish growth in China and Europe will reduce oil demand growth to 1.2 million barrels a day in 2016, down from 1.8 million barrels a day in 2015. At the same time major producers pumped higher-than-normal volumes of crude in January. The top two, Russia and Saudi Arabia for instance, produced near record volumes of 10.9 million and 10.2 million barrels a day respectively. See the chart here.
While some are banking on an output freeze agreement between the world’s major producers this weekend, capping production at record highs is not likely to alleviate the existing supply glut. See: OPEC Doha meeting.
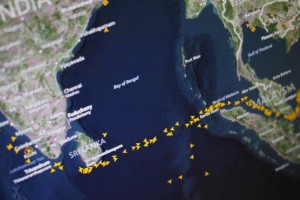
All around the world, supertankers are lined up in massive traffic jams hoping to get their product to shore before prices drop further. See: Band plays on, global oil glut leaves tankers in huge traffic jam.

VLCC supertankers are seen travelling between India and Southeast Asia in this illustration photo of an Eikon ship-tracking screen April 7, 2016. REUTERS/Thomas White/Illustration
“As ports struggle to cope with a global oil glut, huge queues of supertankers have formed in some of the world’s busiest sea lanes, where some 200 million barrels of crude lies waiting to be loaded or delivered.
The vessels, filled with oil worth around $7.5 billion at current market prices, would stretch for almost 40 km (25 miles) if formed up in one straight line.”
Which brings us to this chart showing the recent trader-driven rebound in WTI amid the price big picture since 2006….bullish?


