An IMF report warns that following 16 years of expansionist monetary policies, the world was a record $152 trillion dollars in debt at the end of 2015, more than double the amount owed in 2000. The debt represented 225% of global gross domestic product (GDP), up from 200% in 2002.
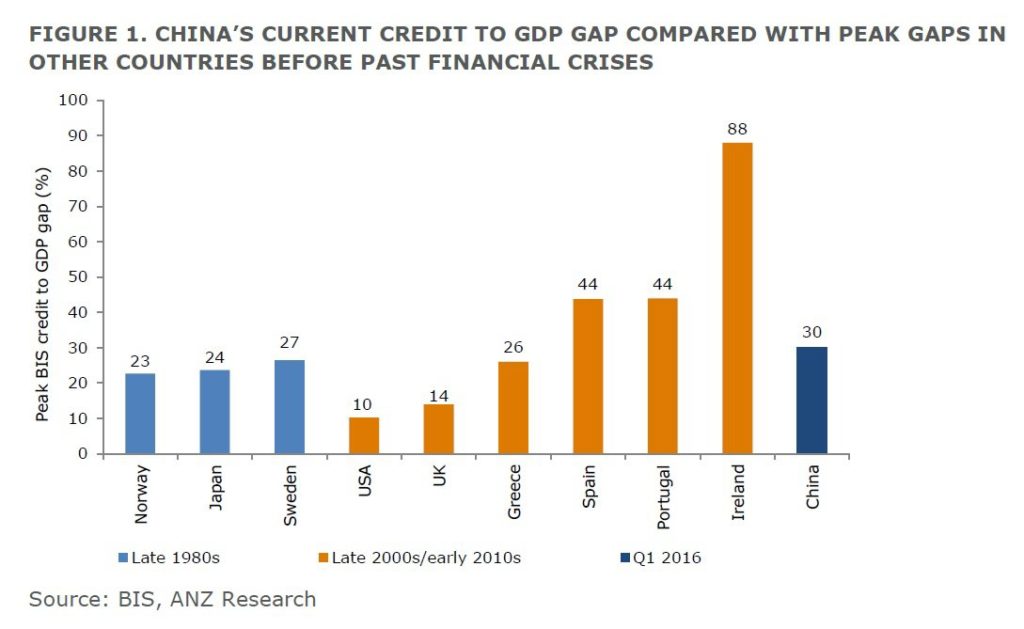
The organization further points out that private debt is high not only among advanced economies but also in a few “systemically important” emerging market economies, namely Brazil and China. See: Chinese policymakers face a difficult balancing act. The below chart from ANZ shows how China’s credit-to-GDP ratio currently compares to the peak seen in other nations before the onset of past financial crises. This ratio is calculated by the Bank of International Settlements (BIS) as the difference between the ratio of private non-financial credit to GDP against its long-run trend.
Though the credit explosion over the past 8 years certainly boosted sales and economic activity in the short term, it has also likewise purchased a lower for longer period of economic weakness to follow. We are there now and no one should be surprised or unprepared.
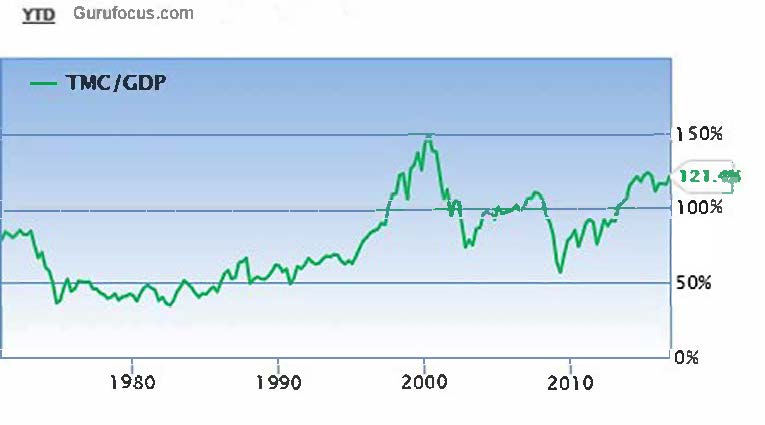
And as Michael Pento points out asset prices are not prepared for this reality. The median price-to-earnings, price-to-sales and total-market-cap-to-GDP ratios all show markets as over-valued as the worst bubble peaks in history. This chart showing the market cap of US equities at 121% of GDP offers some historical perspective as to where we are now, and where prices must mean revert in order to restore long term historical norms.
Total market cap to GDP ratio

Adding debt on debt is not our savior, it is our collective demise. Until we admit and repent this destructive behavior, the global economy cannot reform and recover. In the meantime, downside shocks will continue to mount.


