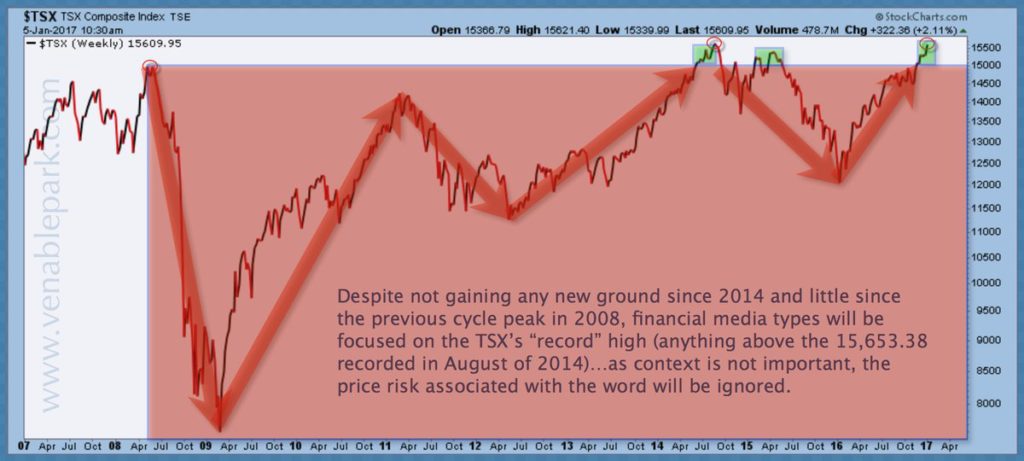
Trumphoria has taken North American stock markets back to the brink over the past few months. This chart of the Canadian TSX since 2007, shows the wild ride and stagnate decade that has plagued Canadian stocks and the mutual funds, asset managers, pensions and ETFs that are designed to track it top to bottom, over and over again.

Meanwhile capital deficits have compounded throughout and Main Street is left with woefully insufficient savings. The next cyclical bear market will make this painfully apparent even to those who are currently banking on permanently high plateaus holding indefinitely. Go ahead and ask your advisor or manager when they will sell equity holdings to protect capital from cyclical (and secular) mean reversion? (Spoiler alert: the answer is never!) Getting customers to buy, hold and hope, is the finance sector’s business model. It’s all about keeping a constant distribution channel open to receive products and drive profits for the industry.
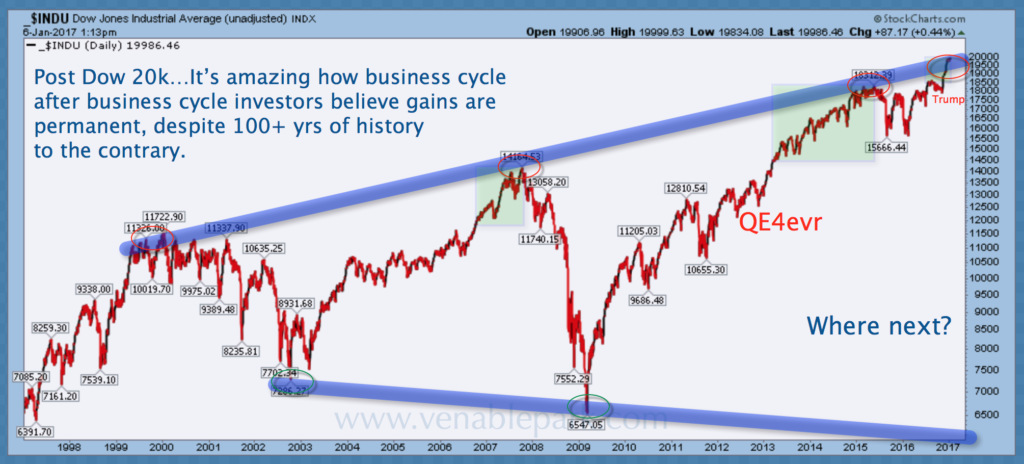
Below is my partner Cory Venable’s chart of the Dow since 1997. The next (and hopefully final) secular bottom test is yet to come. We must not let higher price levels obfuscate the secular trend. Secular cycles are not defined by price, but by asset valuations that move from historic peaks to below historic average ‘troughs’ by the end. Today stocks remain near all-time secular high valuations, and this is the most important marker to note.


