The news flow of the past decade (century+) confirms the truth about ‘trading’ financial markets. Unless one exploits some privileged advance or inside information (which is commonly done but generally illegal) or is using high frequency machines that allow them to take lightning speed advantage of slower moving capital (which should be illegal and no doubt will be eventually), then ‘traders’ are speculators that frequently go bust–sometimes repeatedly. Some get lucky and win on timing without unfair or illegal advantage, but they must also then exercise the discipline to cash out their chips and go home, or as with gamblers at the casino, luck (price) always turns, and all will be lost once more.
The thrill and danger of chance no doubt can appeal to those hoping to take shortcuts to riches, but the lure of easy money most often ends in a slippery slope to mental and financial hell.
We all take concentrated career risks in our chosen field or business to earn our living. But this is very different from speculating with our savings once obtained. Those who seek financial security and self-preservation realize that they must consistently make prudent, careful, financial choices in order to build and preserve capital over their lifetime.
For those that are sworn off gambling or illegal acts, and seek to make higher probability investments with their savings, then attention to a valuation discipline and longer term cyclical and secular trends, are the best tools we have to control risk and navigate through a future that is perpetually uncertain.
Financial propaganda aside, what matters is not how much assets ‘make’ in a given year, but rather what capital one retains over each full market cycle. So we can only ever accurately measure investment success from market cycle trough to trough. In reality, most managers and do-it-yourself-ers attribute gains into market peaks as their investment acumen, and then give it all back and more in the down cycle, where they blame factors beyond their control.
The last troughs were in 2002-3 and 2008-9. We cannot know where the next cyclical trough lies, but we can know that it is overdue and we should be expecting it any day now. We also should know that because of record financial engineering and leverage over the past decade, the mean reversion back below trend this cycle, is likely to be at least -50% from current levels.
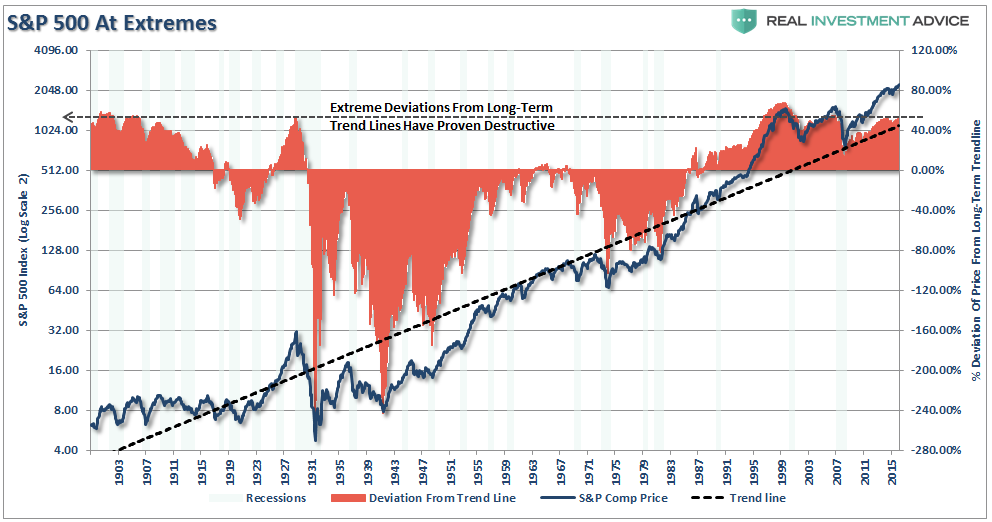
Lance Roberts offers an on point chart (below) and commentary this week in The Psychological Impact of Loss:
Currently, while only slightly below the peak of the 2000 “dot.com” bubble, the deviation [from long term trend line dotted below] is at levels that have ALWAYS coincided with a negative mean reverting event or very poor, and highly volatile, forward returns.”
“Of course, like “crying wolf,” when these short-term patterns and long-term prognostications fail to immediately validate themselves, they are summarily dismissed as being wrong, or just “mumbo jumbo,” which often leads to unwanted outcomes.
The primary problem is the “duration mismatch” between most technical analysis, which is typically very short-term (minute, hourly, daily), and the outlook for investors which is in years.
We also must keep in mind that we are overdue today, not just for a cyclical end of the market expansion (that began in 2009), but also of the secular decline in valuations that began from the record peak in 2000.
Secular valuation bottoms historically take 15 to 20 years to complete, and another 10+ years before recovering the prior secular peak once more. Many today are hoping (ignorantly or optimistically) that the 14 years between the US market price peak in 2000 and the recovery and break above that price in late 2014 marks an unprecedented quick end to the latest secular bear (see below).

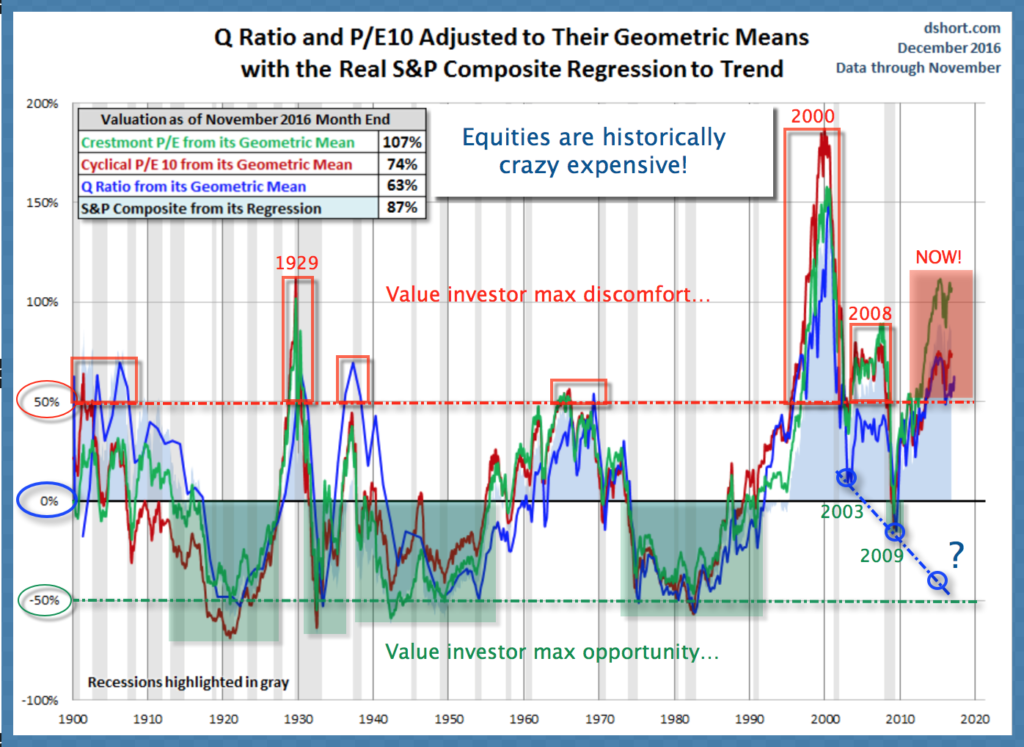
But that is to confuse price with valuations. It is asset valuations that define the start and end of secular market periods, not price levels. This next chart (below) shows secular valuation cycles since 1900 and where we are today versus the secular peak in 2000.

Suffice to say: there is no evidence that we are through this historic and necessary mean reversion episode yet. And most importantly, once valuations do retrace below the historic mean (black zero line above), we should expect at least a decade+ before they venture back above mean once more.
Bob Farrell’s #4 Market Rule: “Exponentially rapidly rising or falling markets usually go further than you think, but they do not correct by going sideways.” “Excesses in one direction will lead to an opposite excess in the other direction.” (#2 Market Rule).
This secular bear period of valuation re-tracement has been distinguished by extreme highs and leverage. We should therefore be prepared for the fact that it is likely to end in extremes in the opposite direction. The question is how many of of the current asset holders will be willing or able to wait 10-20+years just to recover their principle back to present levels? (ie., just to break even).
Despite the natural human tendency to short-term assessments and interim math, investment results can only be accurately measured from market trough to market trough, however long that takes. And in real life, that is the only result that actually matters.


