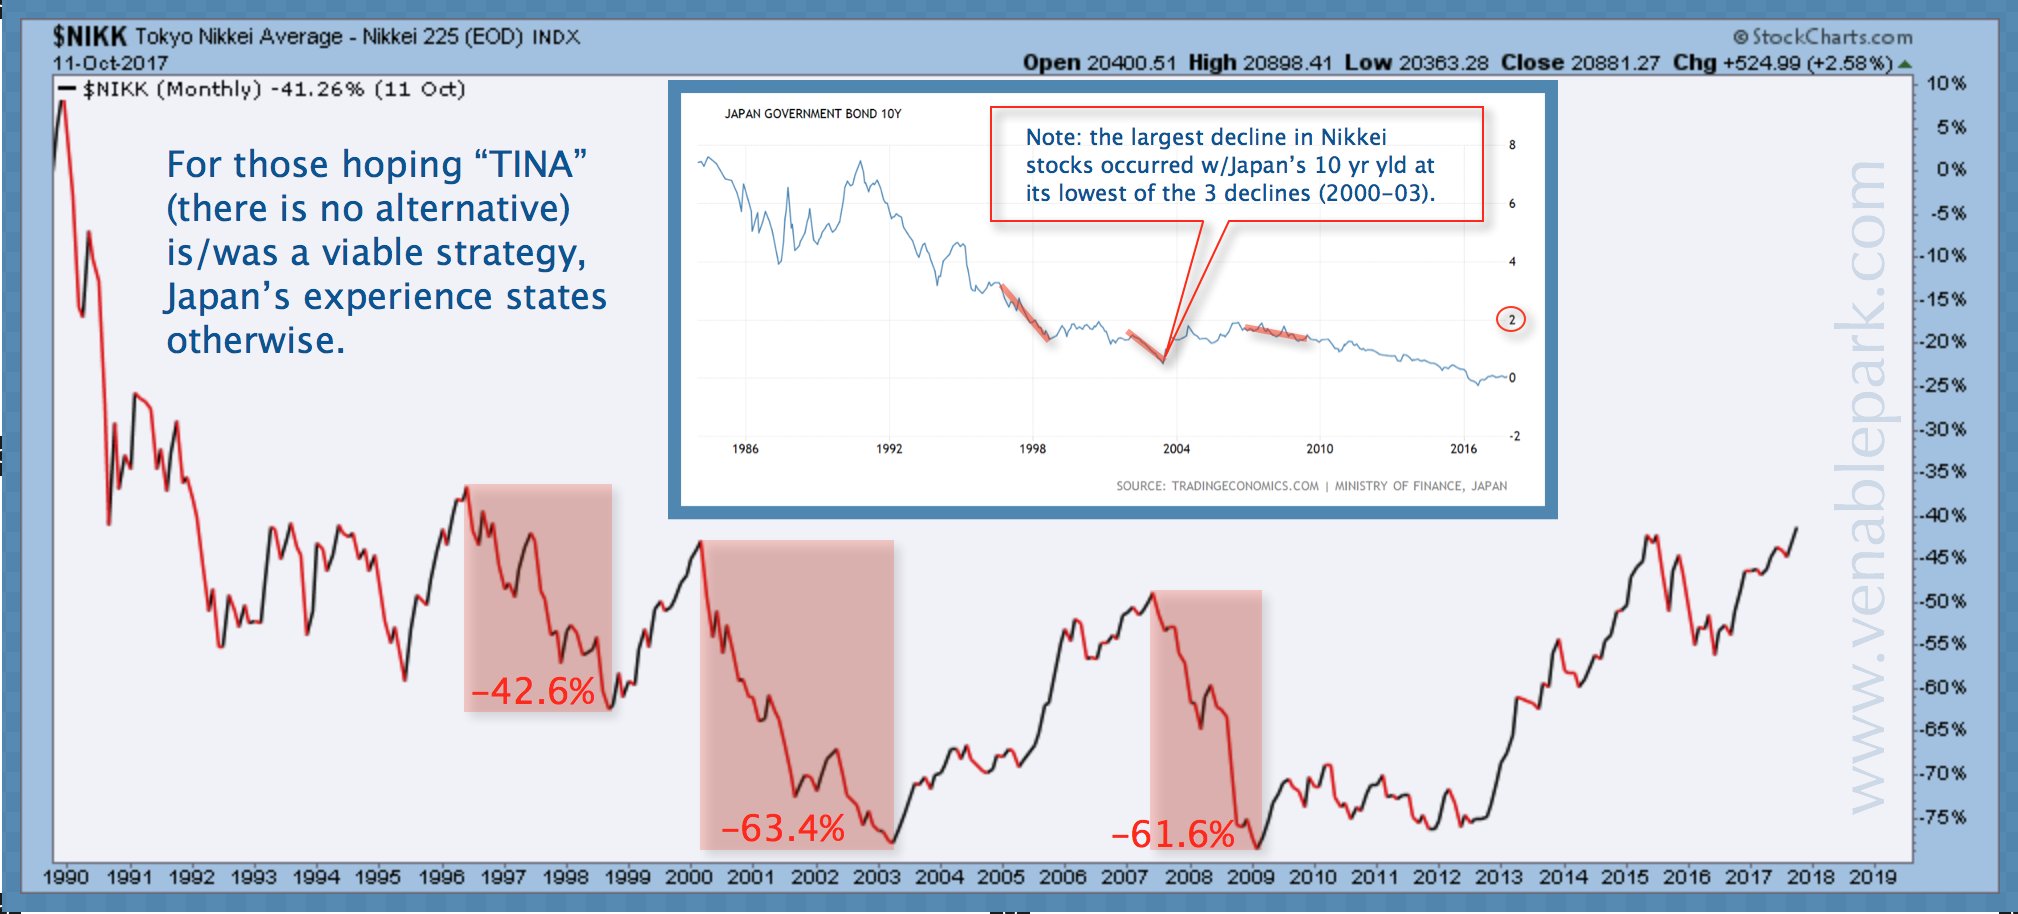
Excited headlines this week point out that after rising some 26% in the past 12 months, Japan’s Nikkei 225 stock index hit a 21 year high, rebounding to just under 21,000. The below chart of the Nikkei since 1990 shows the reality of the Japanese stock market, still some 46% below its last ‘everything bubble peak’ at 38,916 in December 1989.
Twenty-eight years and counting, and Japan’s stock market continues to grind through a secular bear born from obscene over-valuations, leverage and what became a government enabled, national obsession of speculation and reckless risk-taking in property and financial markets. The leverage boom at home, enabled Japan’s speculative frenzy to spread ’round the world, driving up realty prices in places like North America to impossible (and thus unsustainable) levels for domestic home-buyers and renters to afford.

When the deserved mean reversion finally hit in Japan, asset prices plunged 50 to 80% and the debts endured (as they do) like a supernatural force smothering the economy and plunging the nation’s banks into insolvency. After slashing policy rates to zero with little effect, the Bank of Japan (BOJ) began an experimental asset buying program in 2001 called Quantitative Easing that was recommended by then Princeton professor Ben Bernanke (this ringing any bells?). The IOU ‘asset’ buying has continued in various iterations and increasingly larger sums ever since. Today the Bank of Japan owns more than 40% of all Japanese government bonds, and at the end of June, more than 70% of all the common shares listed in Japanese ETFs.
Notwithstanding unending devotion to financially suicidal policies for the nation, and trillions in Ponzi-like financial assets bought with borrowed funds, now piled on central bank balance sheets worldwide, the Japanese stock market has nevertheless, moved through three cyclical declines of 40-63% in the last 20 years and–to repeat–remains 46% below its 1989 high. All the while, Japanese bond yields have moved lower, with now negative yields out to 5 years, and less than .88 all the way out to 30 years.
To all the market cheerleaders who continue to assert that corporate bonds and stocks will keep moving higher because in a world of low yields, ‘there is no alternative’, the history of the past 30 years and beyond, begs to differ. As noted by my partner Cory Venable in the chart above, each time stocks have relapsed into bear markets, government bonds have been bid, pushing their yields even lower as deleveraging participants run for liquidity and cash as the most valuable and essential asset class.
Many valuable lessons can be learned here, but first we need to look and see, and stop following the policies and leaders that have enabled the world through 30 years of wasteful and destabilizing boom and bust cycles to date. Otherwise we are doomed to endure the Sisyphean-like futility of pushing asset prices up only to watch them roll back down wiping out the economy and leaving prosperity and society further behind and ever more desperate.


