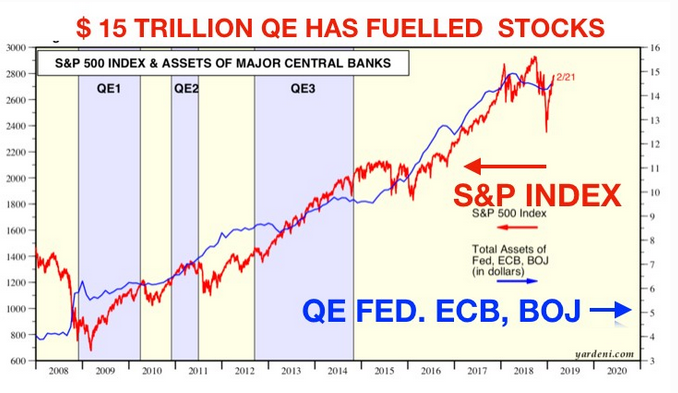
To recap: some $15 trillion in central bank liquidity injections (blue line below) helped drive record share buybacks and the price of U S stocks this cycle (S&P 500 in red) to all time highs on most historically relevant valuation measurements into the fall of 2018, before prices plunged into year-end on hawkish central banks, weakening financial conditions and slowing growth worldwide. Since then stocks recovered sharply into April, as central banks promised to pause hiking plans and stop reducing the bank assets held on their balance sheets.
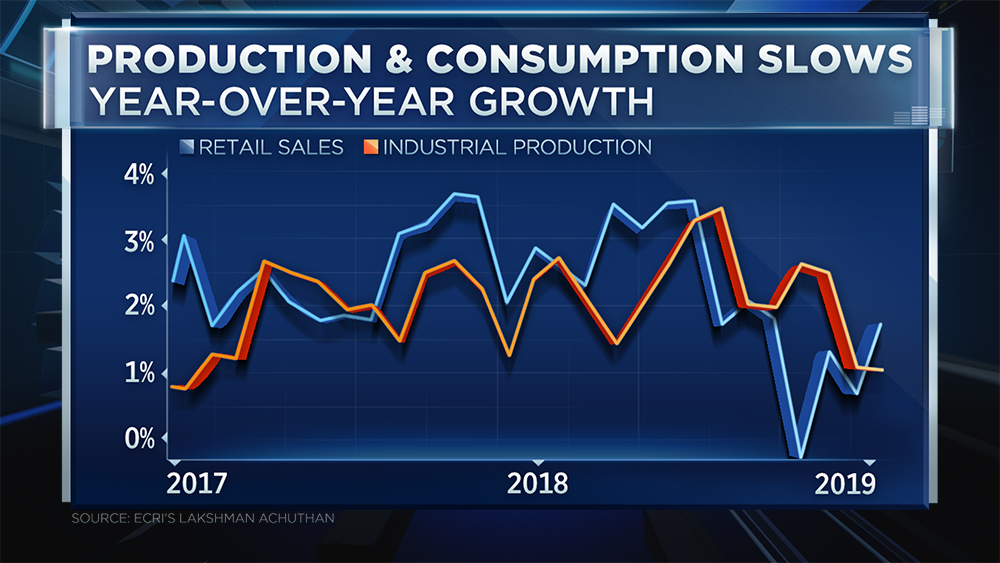
 At the same time, global demand– industrial production (left in orange) and retail sales (in blue)–remains lower and stagnant since 2017. See Chart shows glaring economic risks that could wipe out record highs.
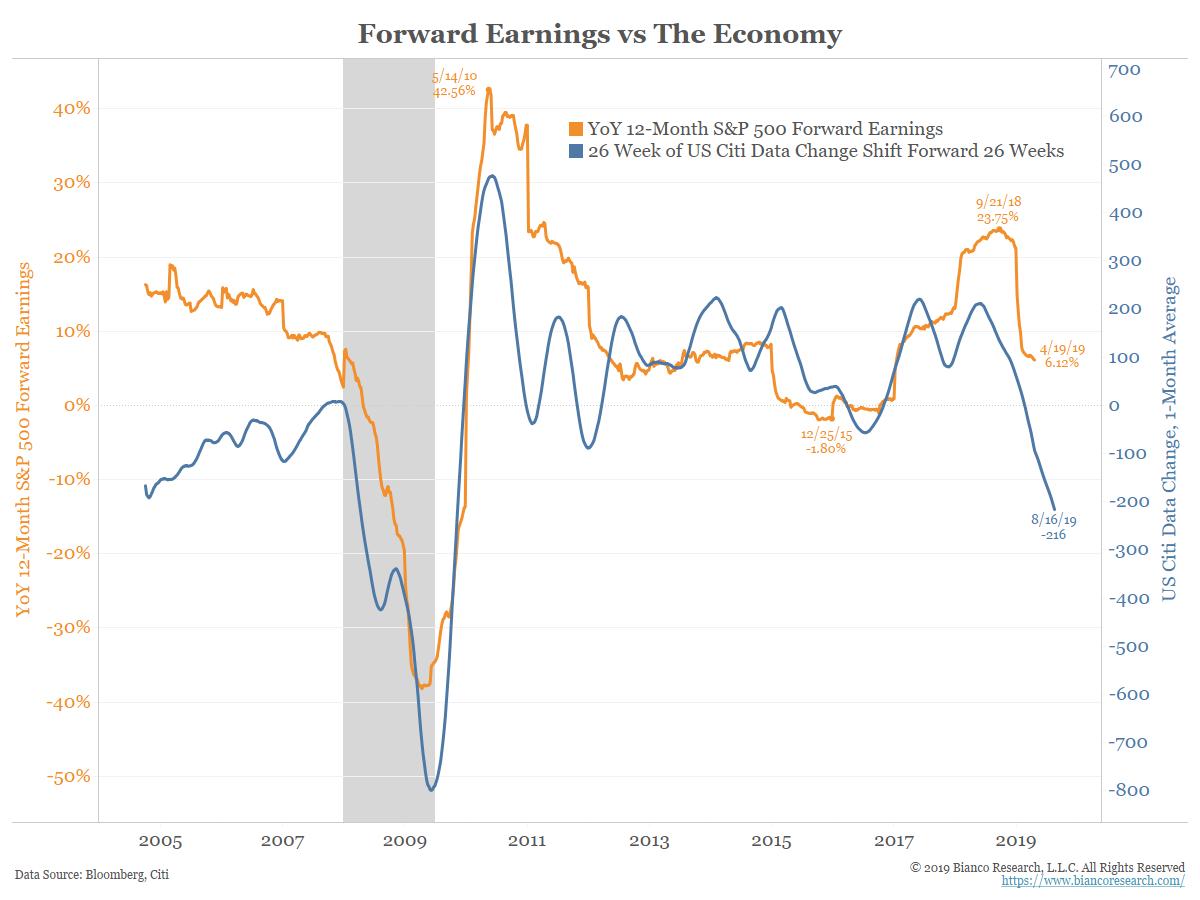
While the year-over-year Citi Data Change Index (in blue below since 2005) which leads the 12-month S&P 500 forward earnings cycle (in orange) by 26 weeks has ignored the bounce in stocks and suggests earnings should continue to decline at least into August.
Stock owners today are either speculating that earnings and global demand cycles are no longer relevant to prices in a world of low rates, attentive central banks and (now waning) corporate buybacks, or they are betting global demand and revenues will suddenly turn higher, support record earnings multiples, and manage to push stock prices perpetually higher still.
Only one thing is certain: gamblers run out of luck eventually and those without a cash-out rule typically lose more than they ever won.


