US Fed Chair Jerome Powell stoked hopes for imminent rate cuts on Wednesday, acknowledging that global growth remains far below the Fed’s forecasts in 2019.
While large-cap shares levitated on prospects of a further reduction in borrowing rates, other economically sensitive markets like small and mid-cap, transportation, bank shares and government bond yields, are not so exuberant. Copper prices and semiconductor sales aren’t feeling the ‘falling global demand is good’ love either.
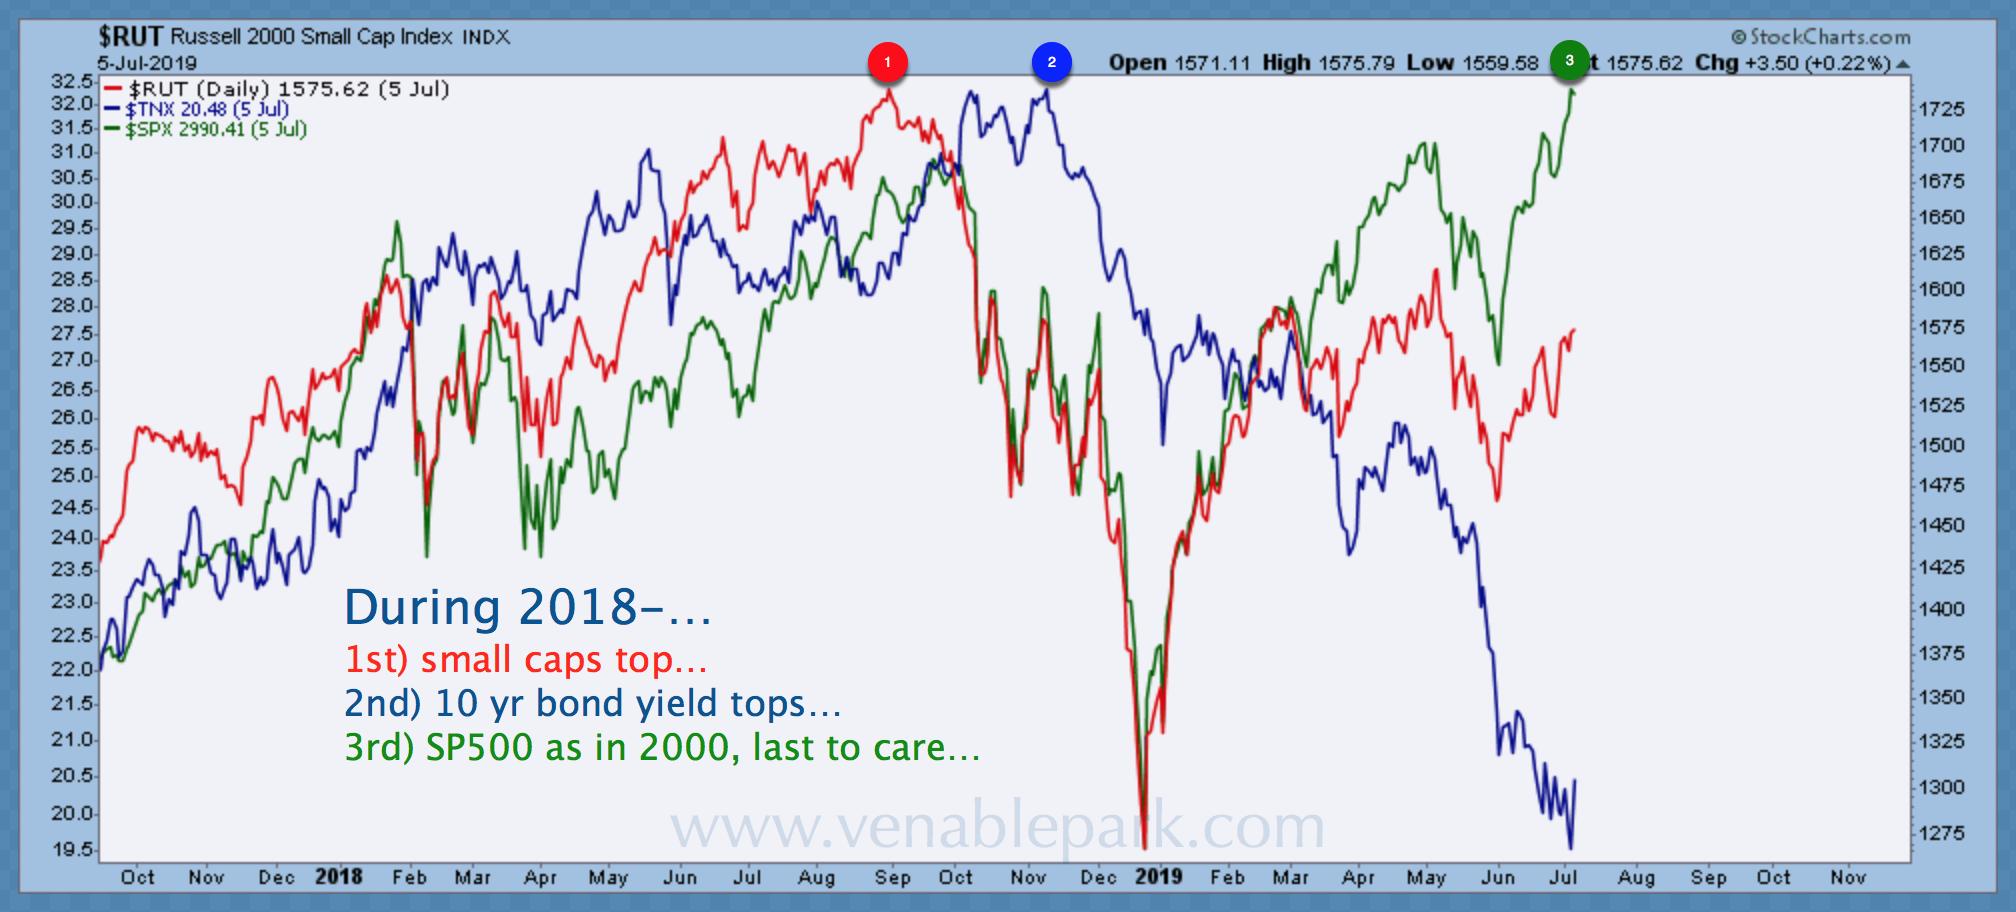
Indeed, as shown in my partner Cory Venable’s chart below, the Russell 2000 index of small-cap US stocks (in red) along with government bond yields (blue) remain well below their 2018 tops.

And as Charles Schwab chief investment strategist noted last week, since the mid-1980s, there were only two other periods (July 1990 and July 1998) when similar non-confirmations occurred between the S&P 500, transport and bank shares, and in both cases, large-cap stocks were down double-digits one-to-two months later. The report also points out that the global Purchasing Managers’ Index (PMI) (advanced two quarters) has been falling for the last 14 months and negative revenue surprises for large-cap companies are the historical norm in such circumstances. See Another Last Goodbye: U.S. stocks’ roller coaster 18 months.
Year to date, weak economic data, faith in central bank puts, and corporate buybacks, have helped large-cap stock indices recover after their 2018 meltdown. The US Fed, aware that asset prices are the last leg of support under the highly levered economy, is once more preparing to cut minuscule rate room in an effort to keep prices near all-time-highs. Despite its hopeful talk yesterday, the Bank of Canada will be forced to follow the Fed’s lead not long after.
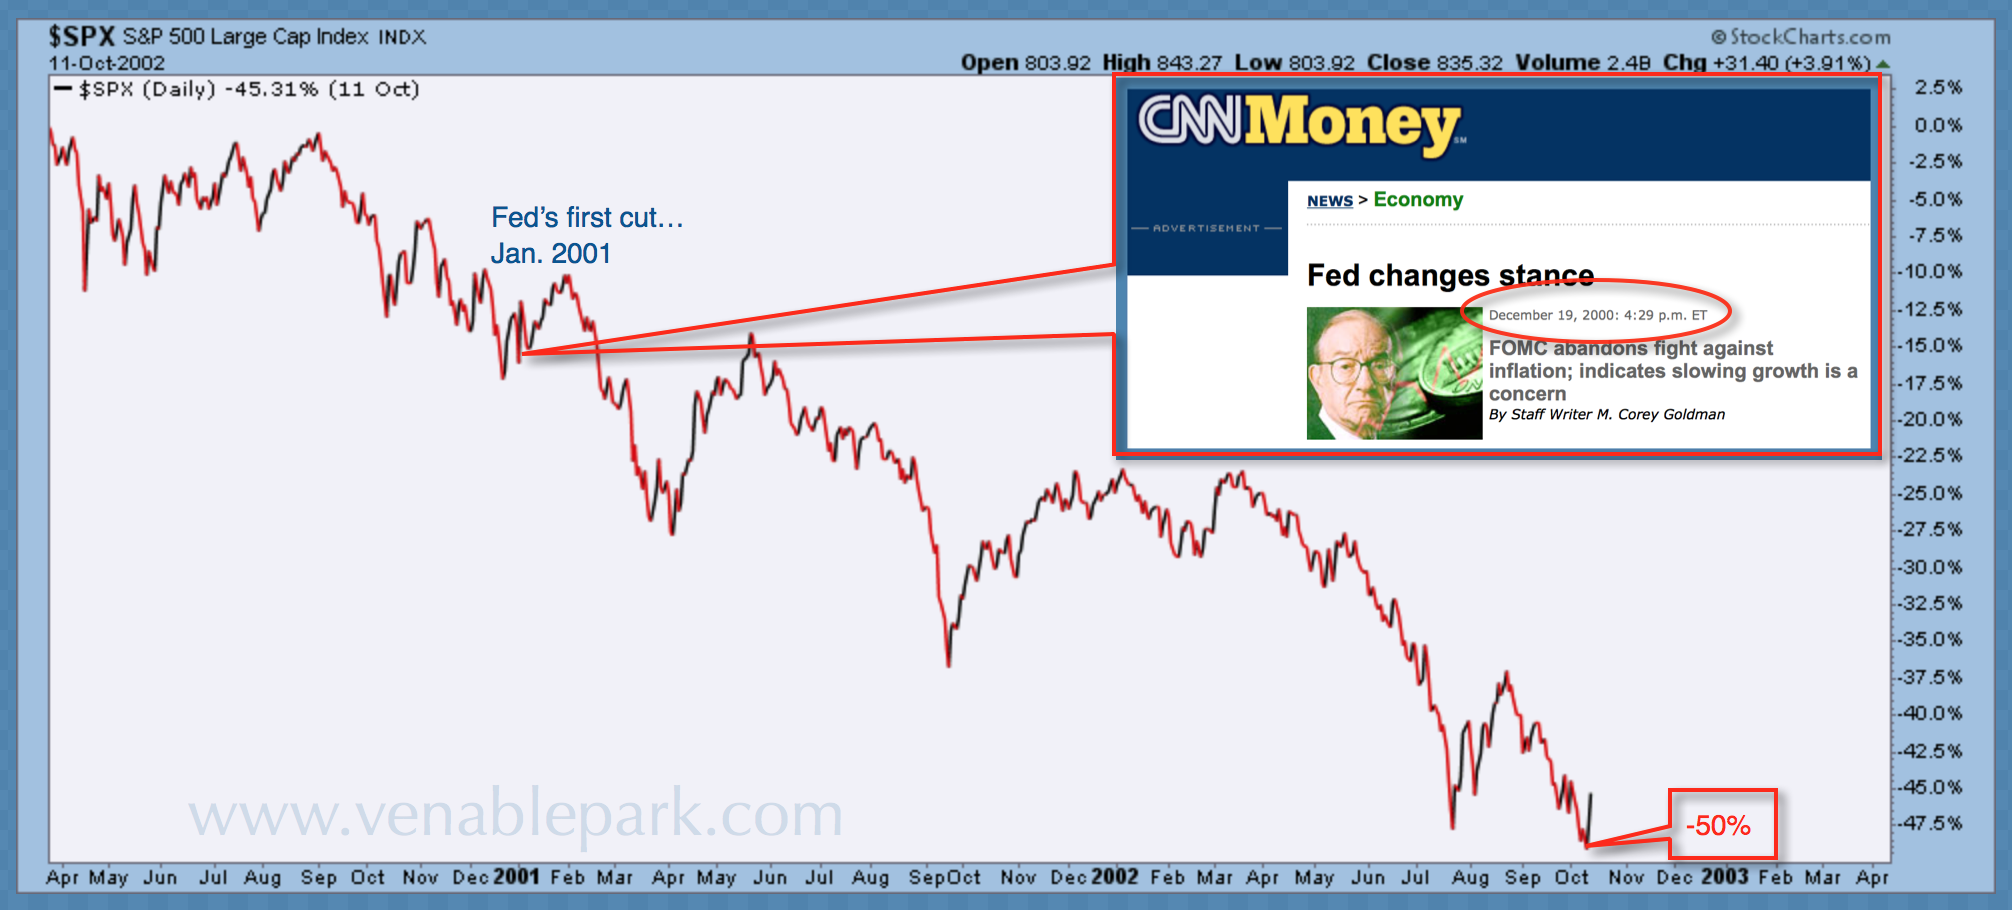
Those managing savings through this cycle must keep their eyes focused on the horizon: protecting capital and preserving liquidity is essential if we are to have valuable buying power in the months ahead. As shown below, in my partner’s Cory Venable’s chart, the Fed’s first rate cut in January 2001 moved from a fat 6.5 to 6% (heading into a relatively mild US recession). The FOMC then hacked off a further 5% of rate room by June 2003, and still, the S&P 500 fell for two years before finally bottoming in 2002 50% below the prior cycle peak.

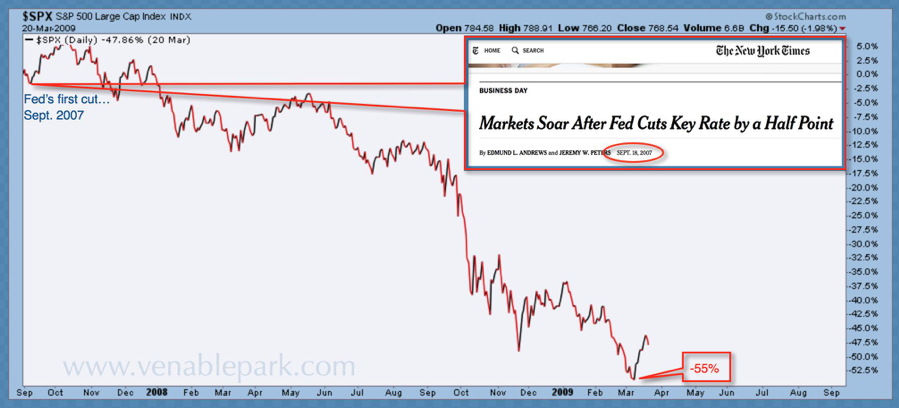
A similar pattern unfolded at the end of the 2002-07 expansion cycle (see below) when the US Fed responded to weakening data with a half-point cut from 5.25 to 4.75 in September 2007, before slashing to the zero bound by December 2008. Still, stocks and most higher-yielding corporate bonds more than halved.
Word to the wise: a new rate cutting cycle is not bullish for equities and corporate bonds, nor for those holding their savings in them.


