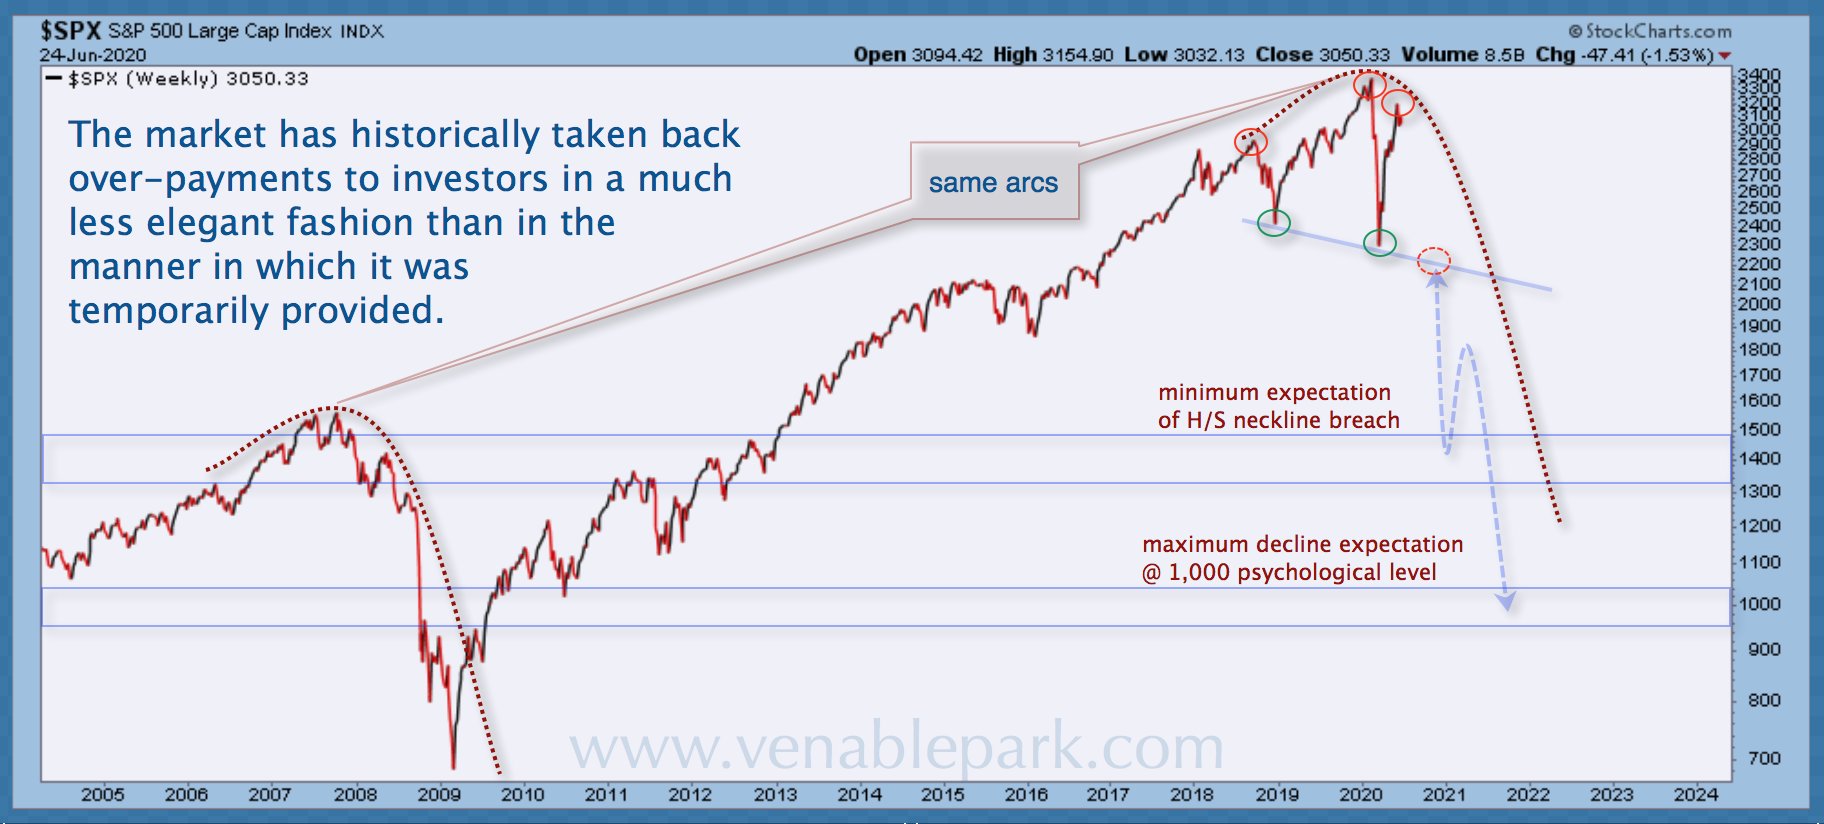
After the 2018 fourth-quarter meltdown, large-cap stocks rebounded on share buybacks to a higher high before hitting the skids this February and taking out the 2018 low. This was a significant breach.
The sequentially lower low circled in my partner Cory Venable’s S&P 500 chart since 2004 below, has now set the neckline for a retest in the 2200 area (red circle) some 27% below current levels.
A similar pattern can be seen above in the 2006-08 topping pattern before the retest broke support into a waterfall cascade to the March 2009 cycle low.
A failure at the 2200 level in the weeks ahead would affirm the probability of a downside test in the 1500 area at a minimum (2007 cycle top) and potentially the 1000 area after that.
Further confirming the ongoing cyclical decline, the 2000 smallest-cap companies in the broad Russell 3000 index did not join large-cap leaders into a new high in 2020. Despite following the big bounce since March, the Russell 2000 remains in a bear market today 20% below its August 2018 top.
Big picture views are needed to navigate full market cycles successfully. Those with savings to lose are wise to remember ladders are routinely followed by snakes that wipe out years of perceived progress in a short period of time. This is why avoiding snakes has to be job number one.


