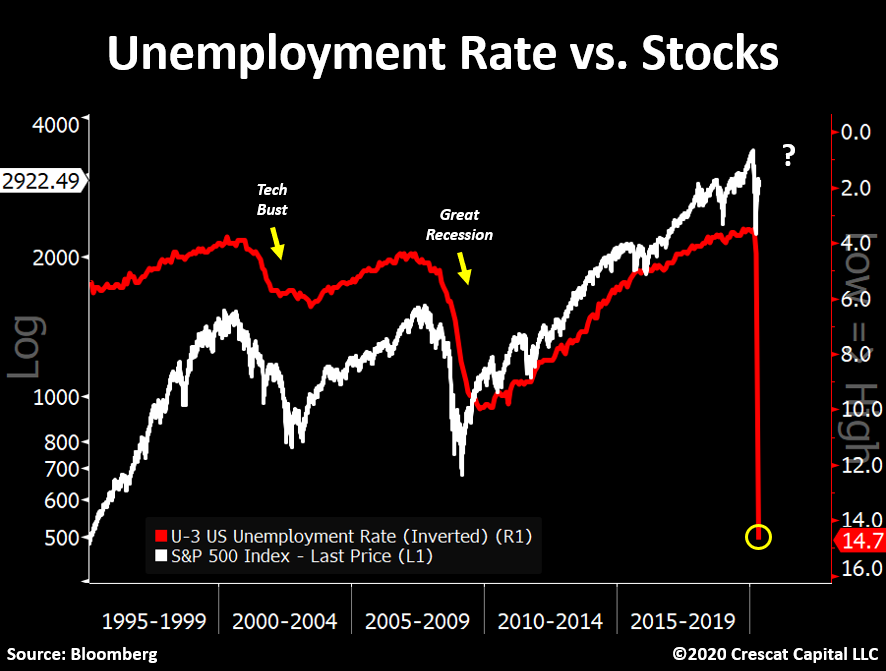
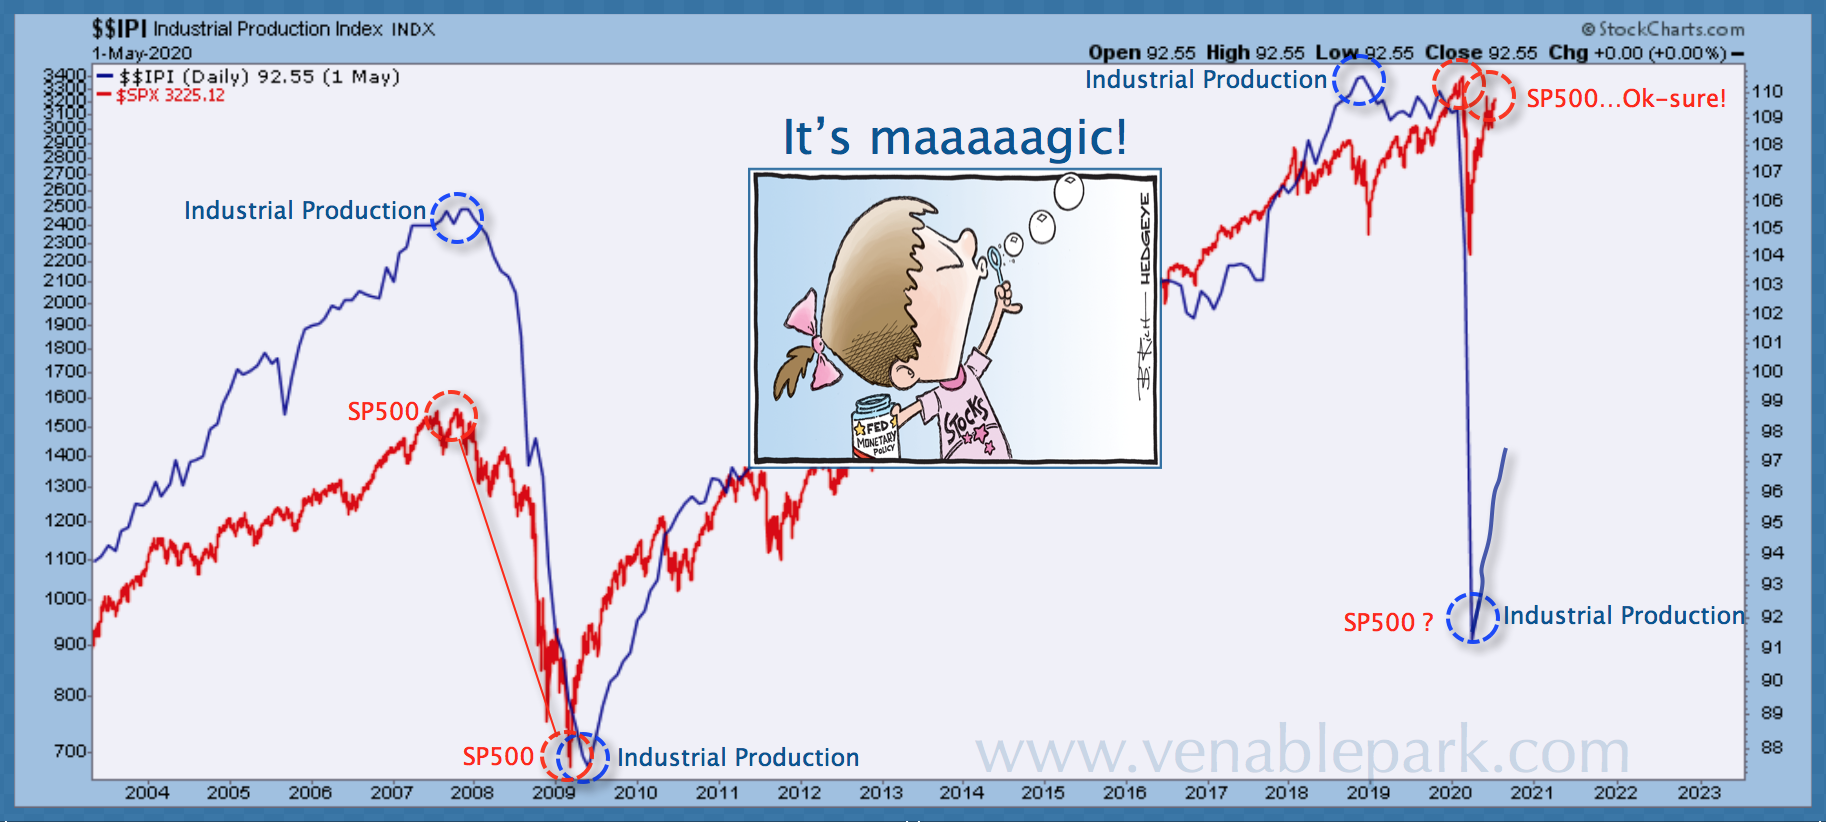
After plummeting between February 20 and March 23, the S&P 500 (below in white) rebounded sharply and is closing in on levels that prevailed at the start of this year. Unemployment meanwhile (inverted in red below), is over three times higher than it was before the Covid-19 outbreak and the highest in decades, as shown in this chart from Crescat Capital. The chart below from my partner Cory Venable shows a similar picture with US industrial production in blue since 2003 versus the wildly unhinged S&P 500 price in July (red line).
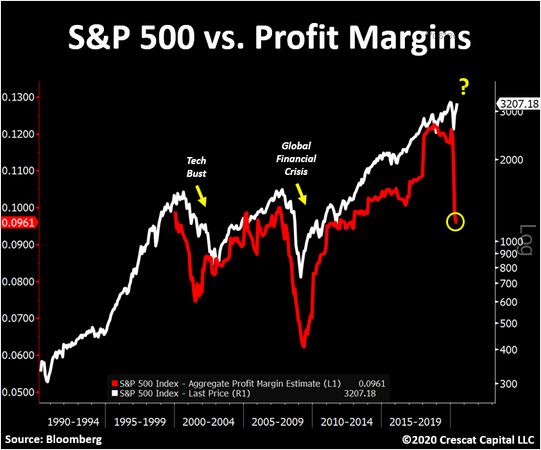
Bulls scream at times like these, “The economy is not the stock market stupid”. True, but textbooks confirm it’s supposed to be a leading indicator of the economy. In recent cycles though, increasingly extreme plunge protection efforts by policymakers have succeeded in intermittently stalling the market’s mean reversion lower from nose-bleed levels. Stalled, but not stopped, it must be said. Stock prices have ended up catching down with real-world economic indicators each cycle eventually. Oh, and profit margins too. As shown in this other bothersome picture from Crescat Capital since 1989, estimated S&P 500 profit margins (in red) also have a signal to share about stock prices (white line) in the months ahead. And it’s not bullish.


