Those who say that it is not possible to recognize financial bubbles in advance are paid not to see them; this group includes most in the asset collection/investment product-selling business and central banks.
Asset valuations, in themselves, cannot tell us when bubbles will burst, but they suggest when we are witnessing them and the depth of liquidation coming on the other side.
Today, equities, corporate and many sovereign bonds (and the funds and ETFs that hold them) are more extremely priced than at any time in at least 70 years.
As shown below, courtesy of Julien Bittel, the US stock market capitalization (price x shares) is today at 1.8X US gross domestic product. This is an incredible 157% above the median since 1950 and 29% above the 2000 dotcom top—a truly incredible bubble.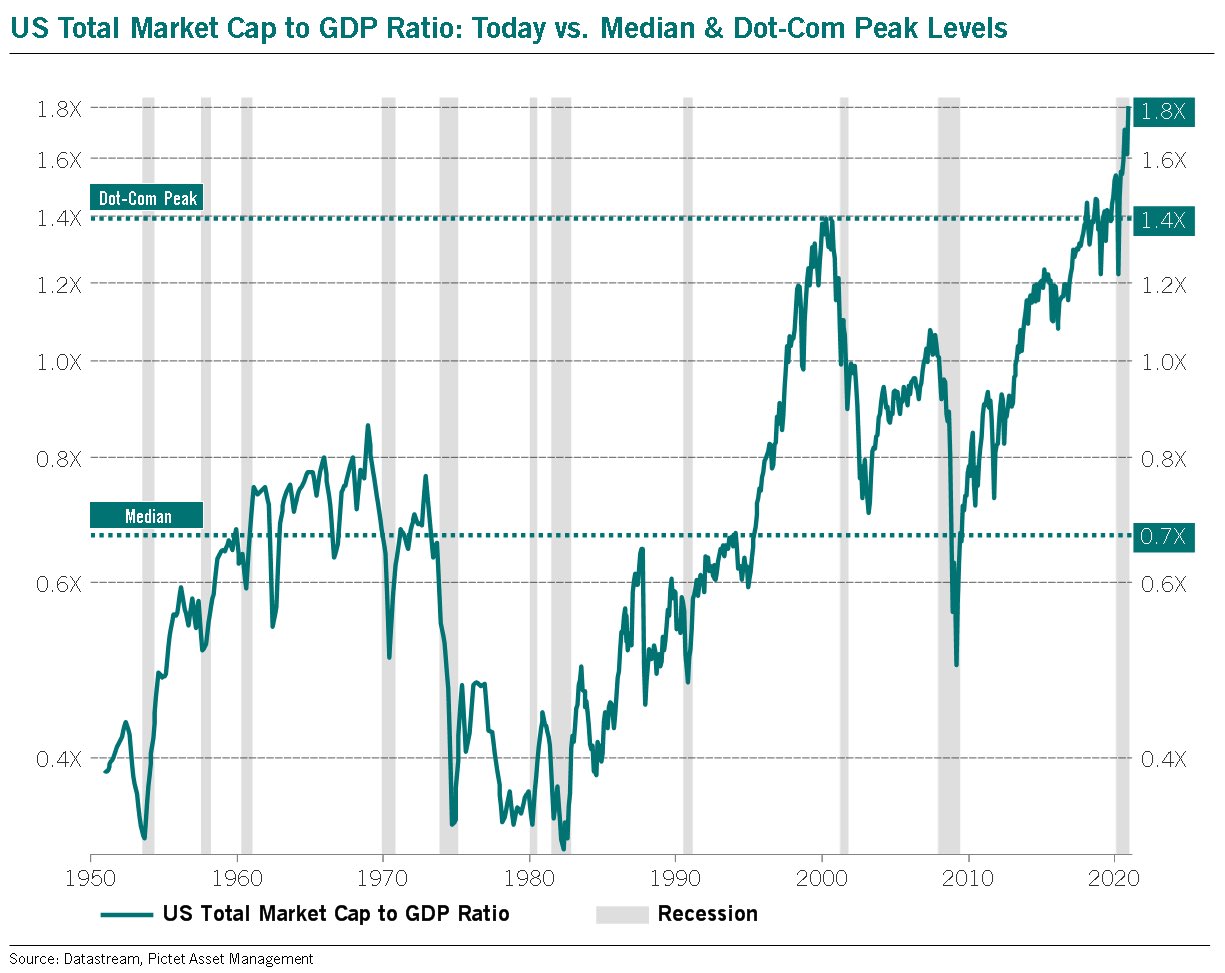
And it’s not just US stocks; with a market cap of about $C 3.2 trillion in 2020 and GDP of some $1.5 trillion, Canada’s TSX is trading at a mindblowing 2.13x 2020 GDP estimates today.
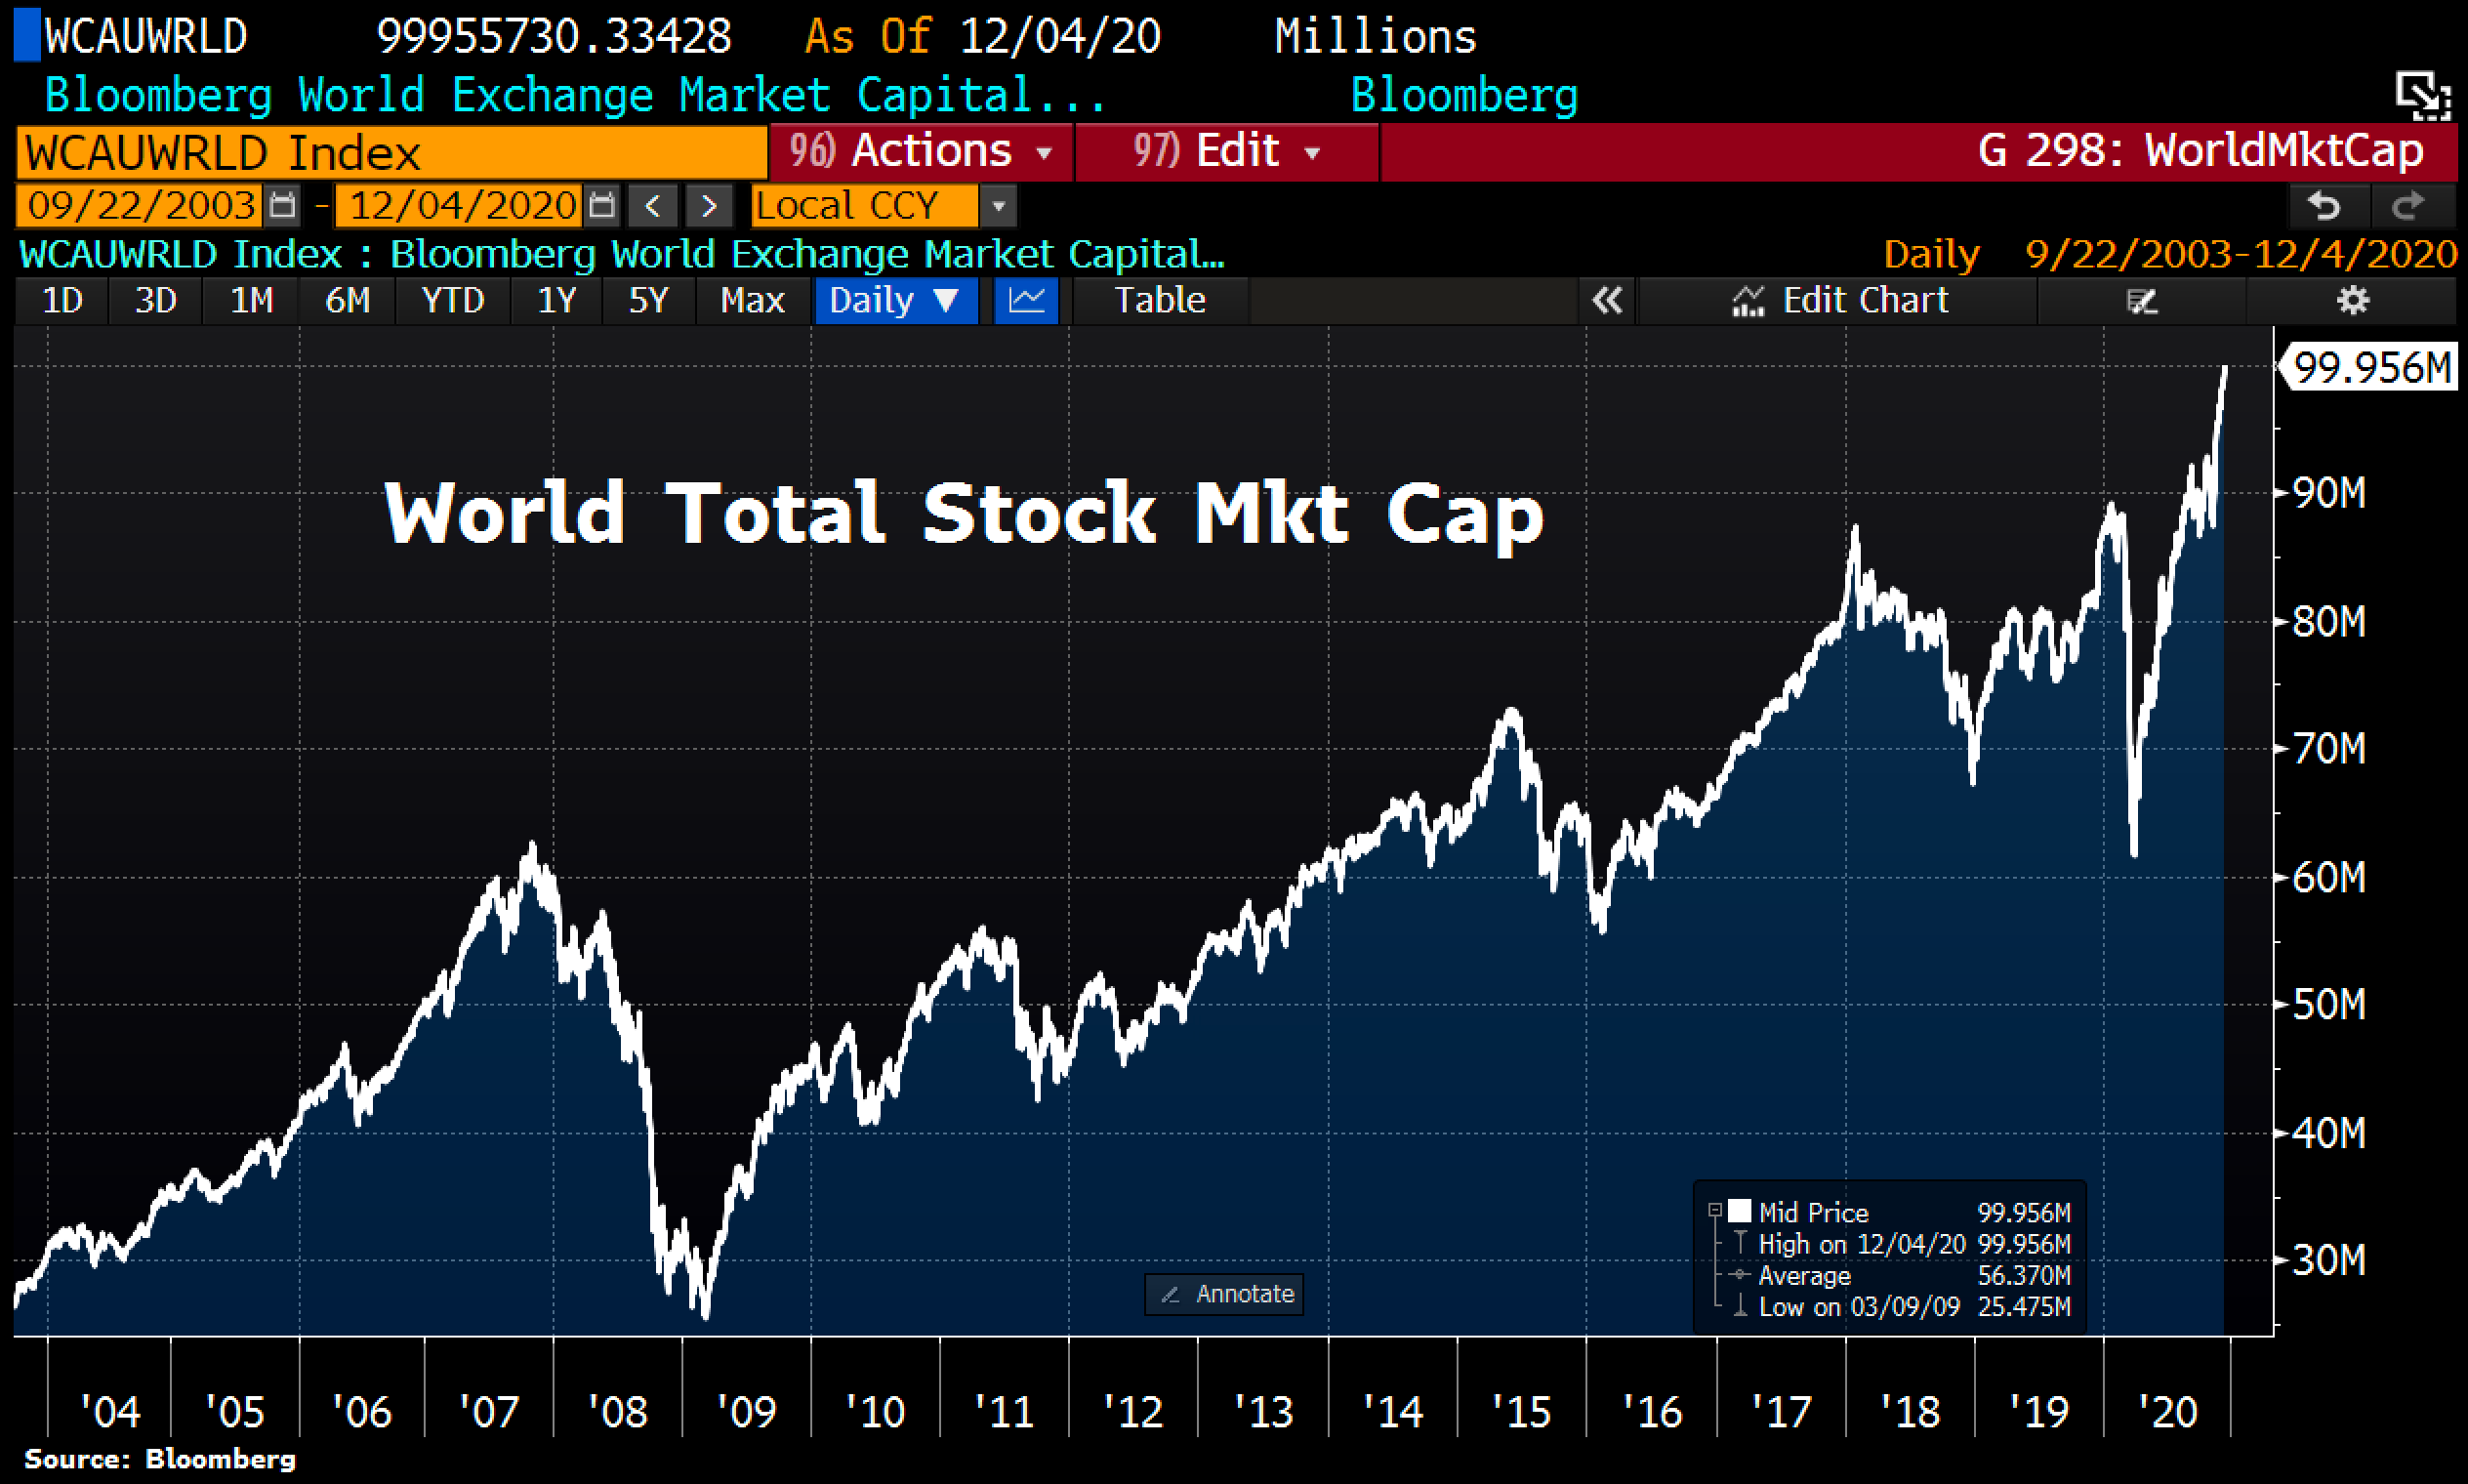
Global stock markets reached $100 trillion in market cap for the first time this month as shown below since 2003 courtesy of Bloomberg and Sven Henrich. This compares with a 2019 gross domestic product, for all countries, of $87.75 trillion and a global recession that has knocked more than 4% off that output number in 2020. This suggests that world stock markets are presently priced at a breathtaking 115% of global GDP.
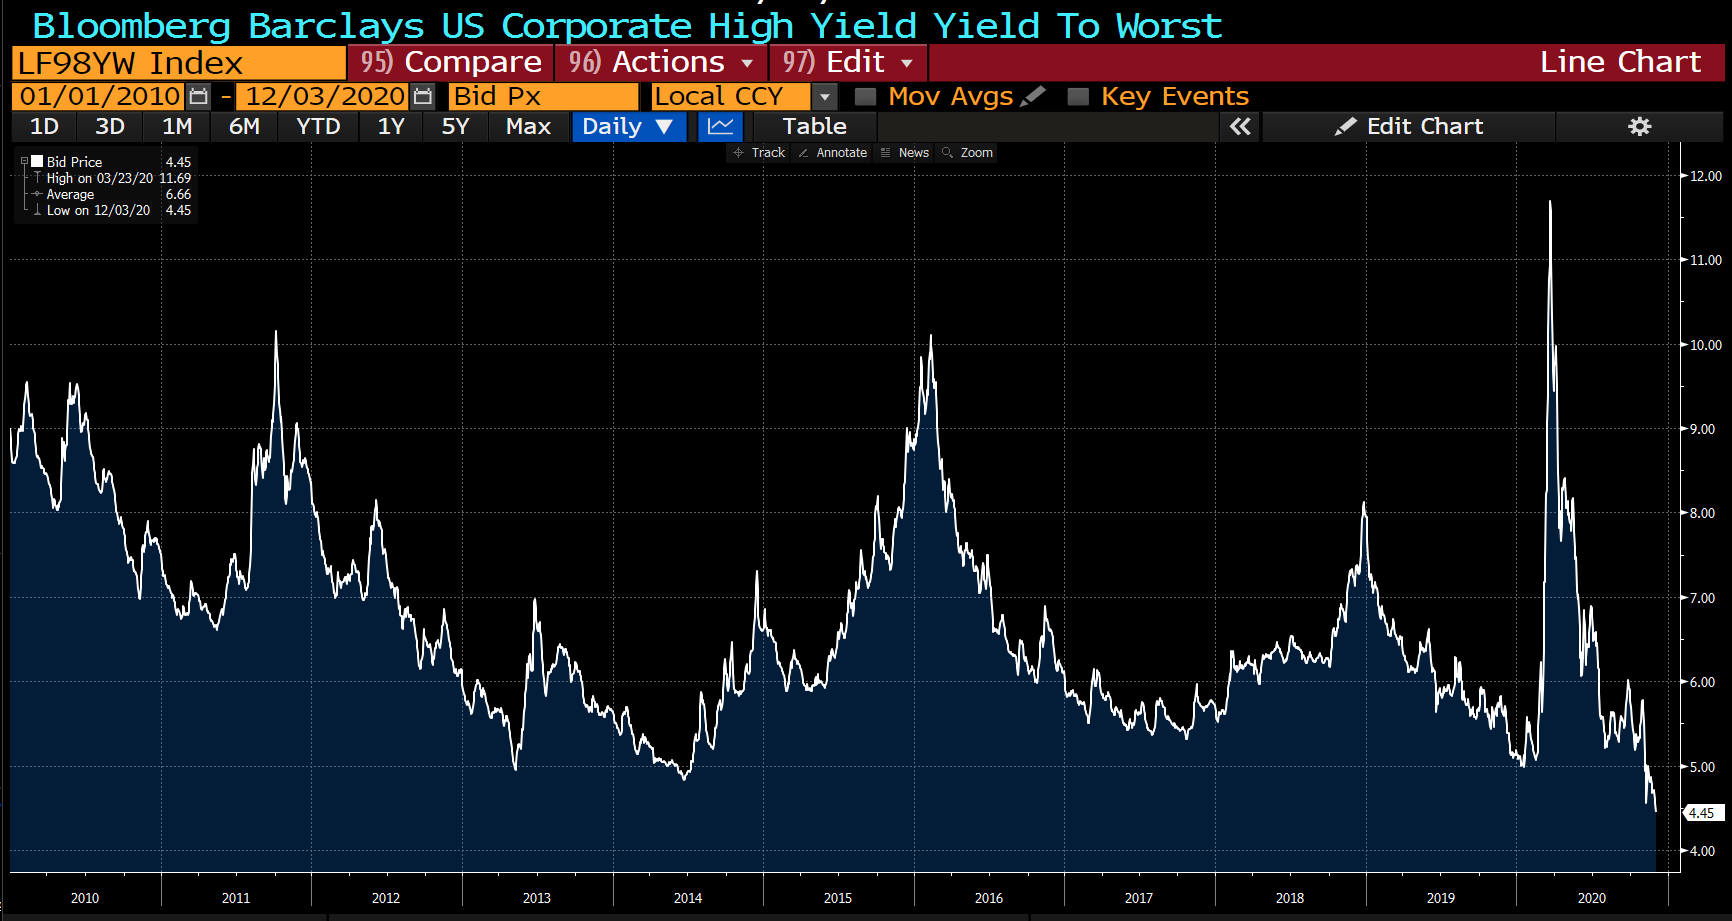
At the same time, the same speculative mania and gushing central bank liquidity have driven the riskiest of corporate bonds so high that the average yield on U.S. junk debt has fallen to an all-time low of 4.45%, more than 2 percentage points below the 10-year average of 6.5%, as shown below since 2008 courtesy of Lisa Abramowicz.
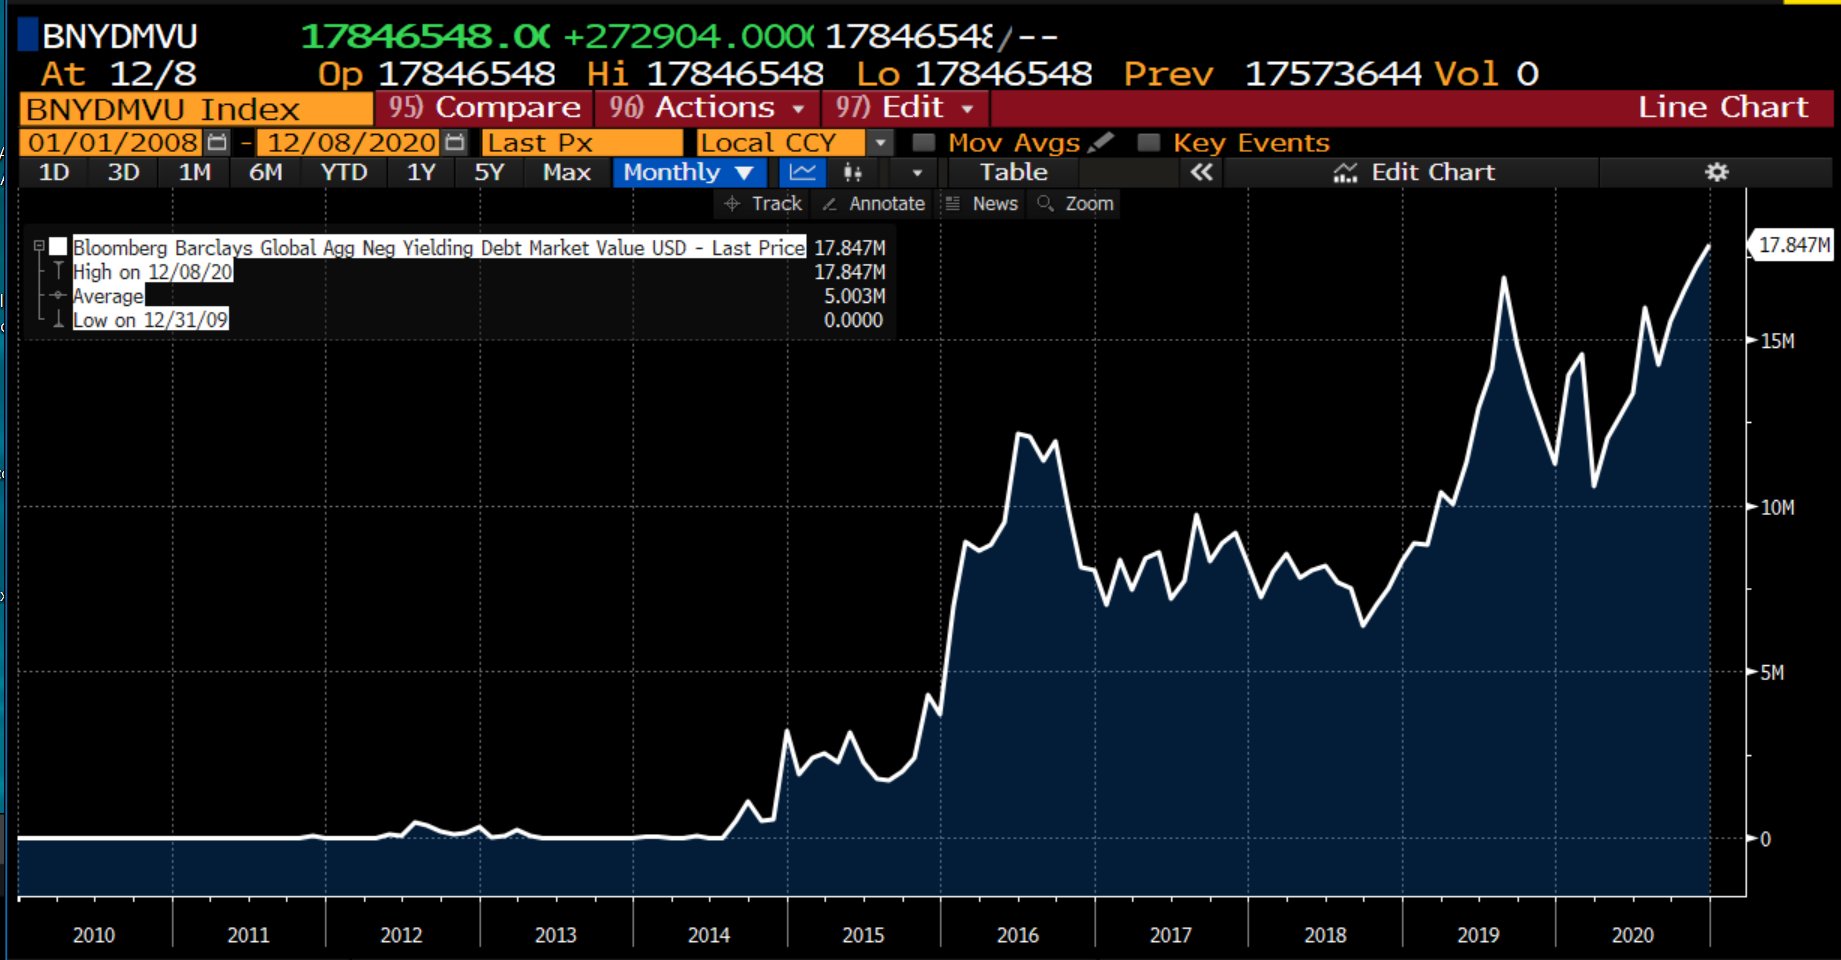
Along for the ride, the price of government bonds for many of the most indebted countries has been bid to such extremes that the quantity of negative-yielding sovereign debt reached $18 trillion last week as charted below since 2009 courtesy of Bloomberg and Randy Woodward.
Most commodities and single-family homes have also seen dramatic price inflation year to date. While some declare that higher shelter prices make homeowners richer, the fact is that they can only make us ‘richer’ if we can sell high and purchase a cheaper shelter that allows us to bank extra savings.
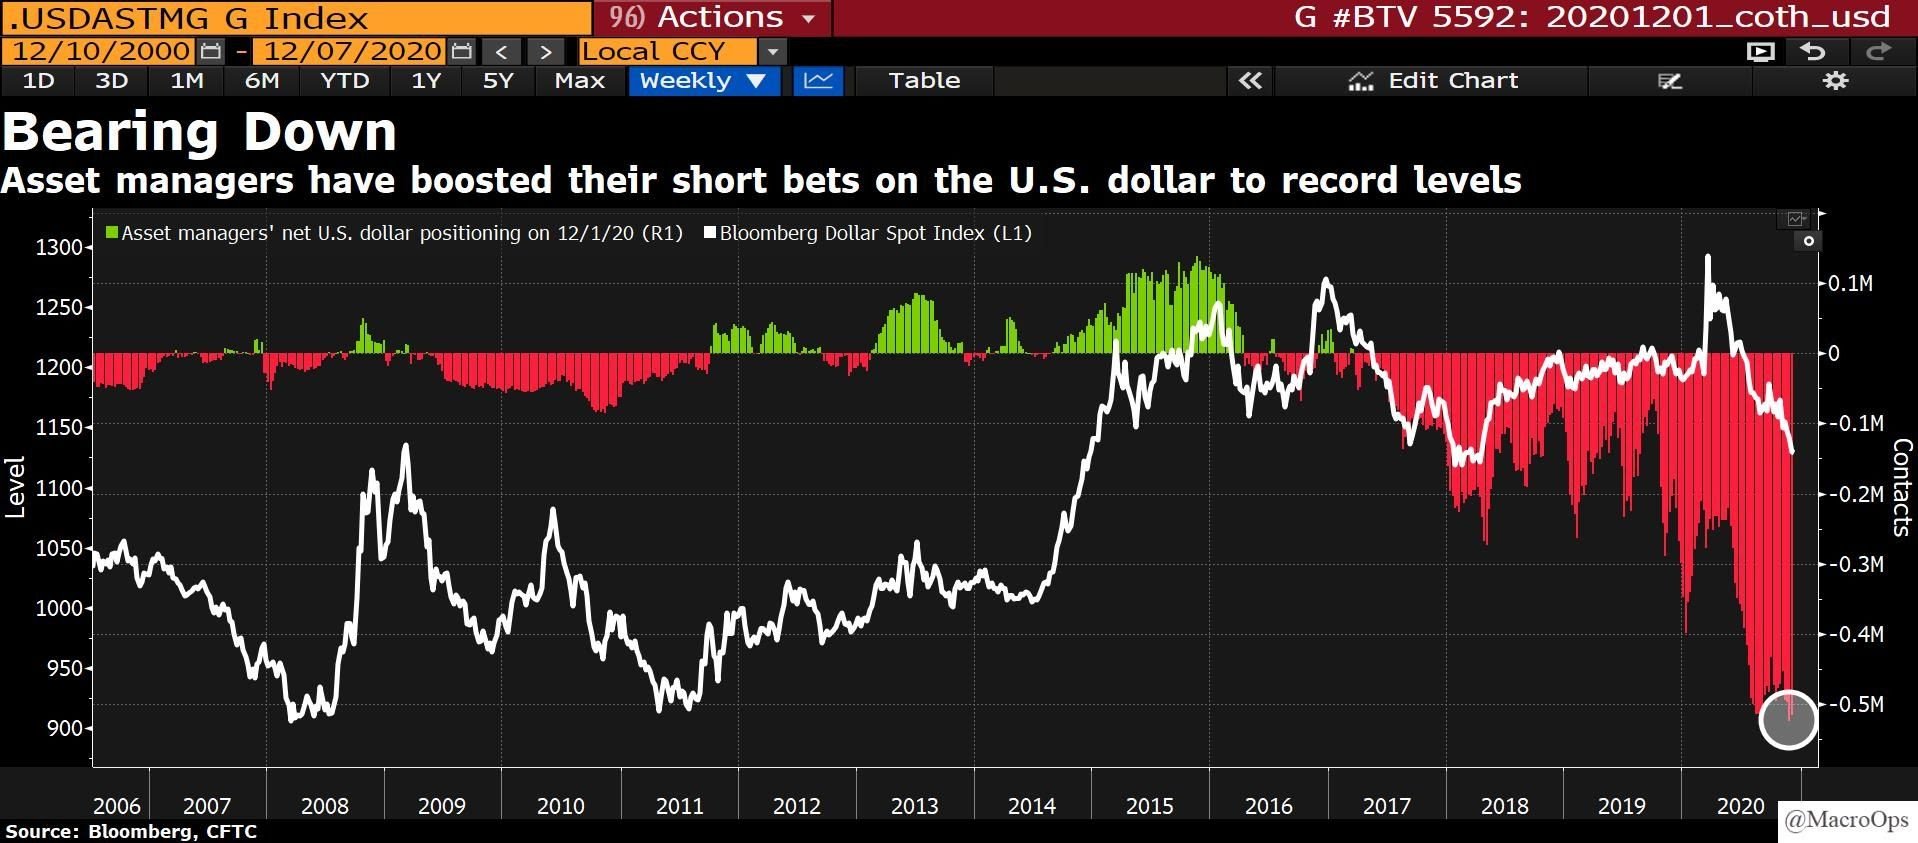
On the other end of the global asset teeter-totter, as shown in red below since 2005, short bets that the US dollar will continue to fall have never been more confident.
With such rampant inflation euphoria, it is nearly impossible to imagine that these bubbles will burst–it was in 1929 too– and yet, they always do.
 It’s pretty straightforward: We don’t have to be mindless. Keeping our heads while the masses are losing theirs is necessary if we are to keep our principal, liquidity and investment optionality when the masses are losing theirs. Investment conditions have never been more treacherous. Those running with the bulls today have a high likelihood of being trampled, while those with investment discipline have a high likelihood of coming out ahead at the end of this historic cycle. These are the facts. Response choices are ours to make.

