The tech-heavy NASDAQ index has now risen 100% since its March 2020 low (see a green rectangle in the chart below from my partner Cory Venable since 2013) amid a pandemic and the worst recession since the 1930s, where thousands of small businesses have closed, unemployment rates have near doubled, and levered gambling has become the pastime of choice for many. Similar trends have swept other risky markets along for the ride. The broader S&P 500 has also leaped, up 78% since last March.
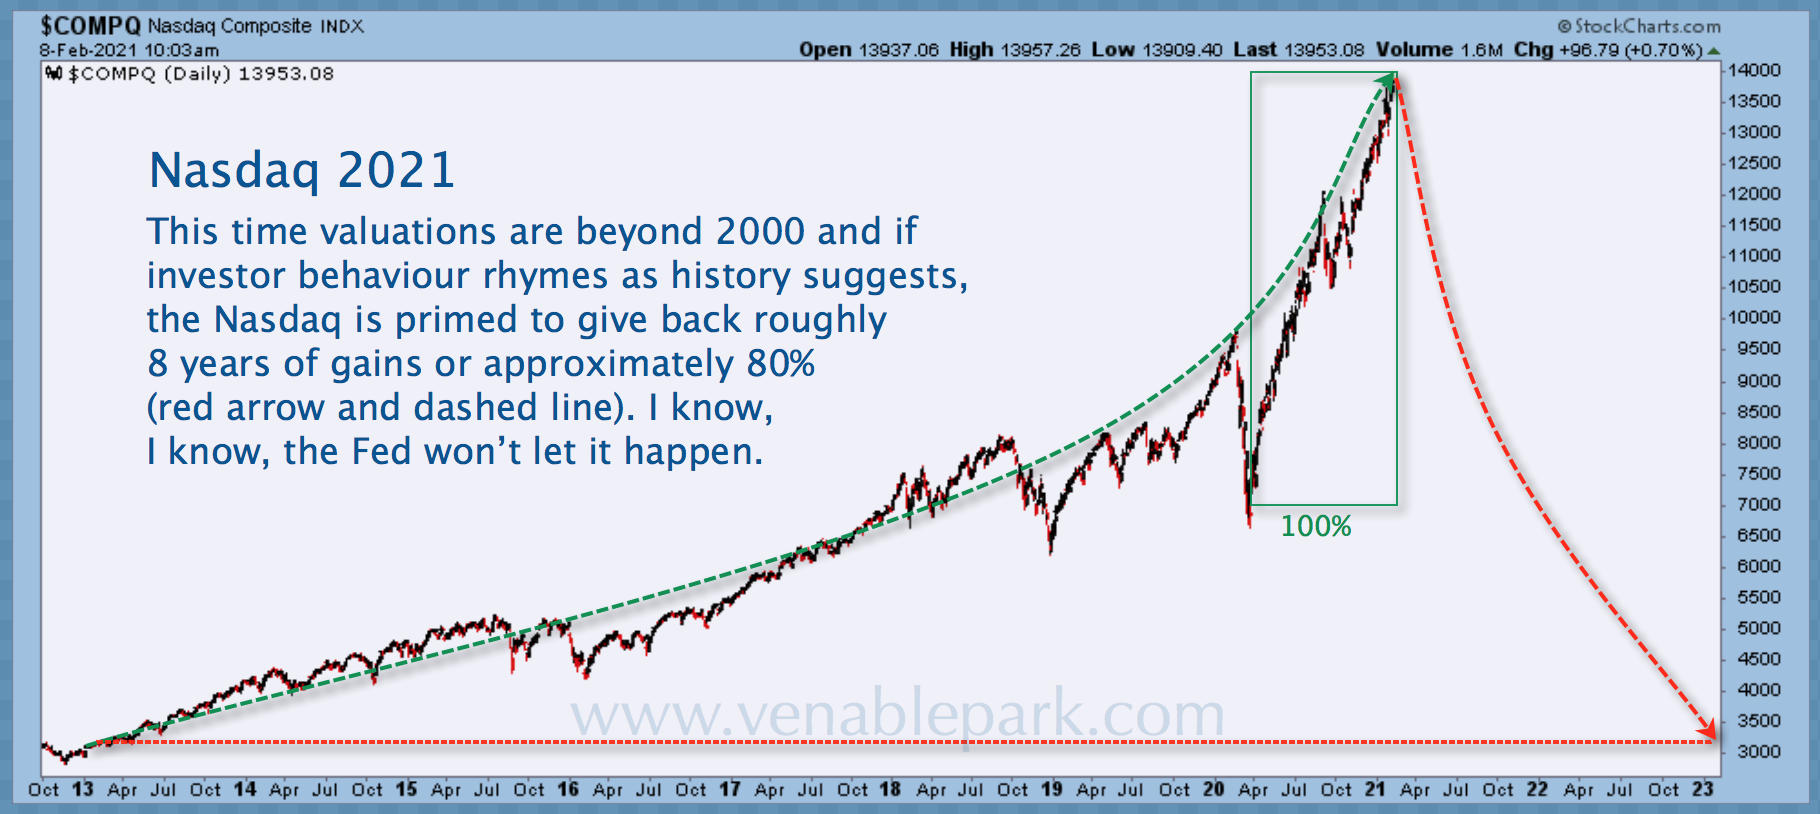
The last time that the NASDAQ index rocketed up 100% in a matter of months was the euphoric doubling between July 1999 and March of 2000 (green rectangle shown below).
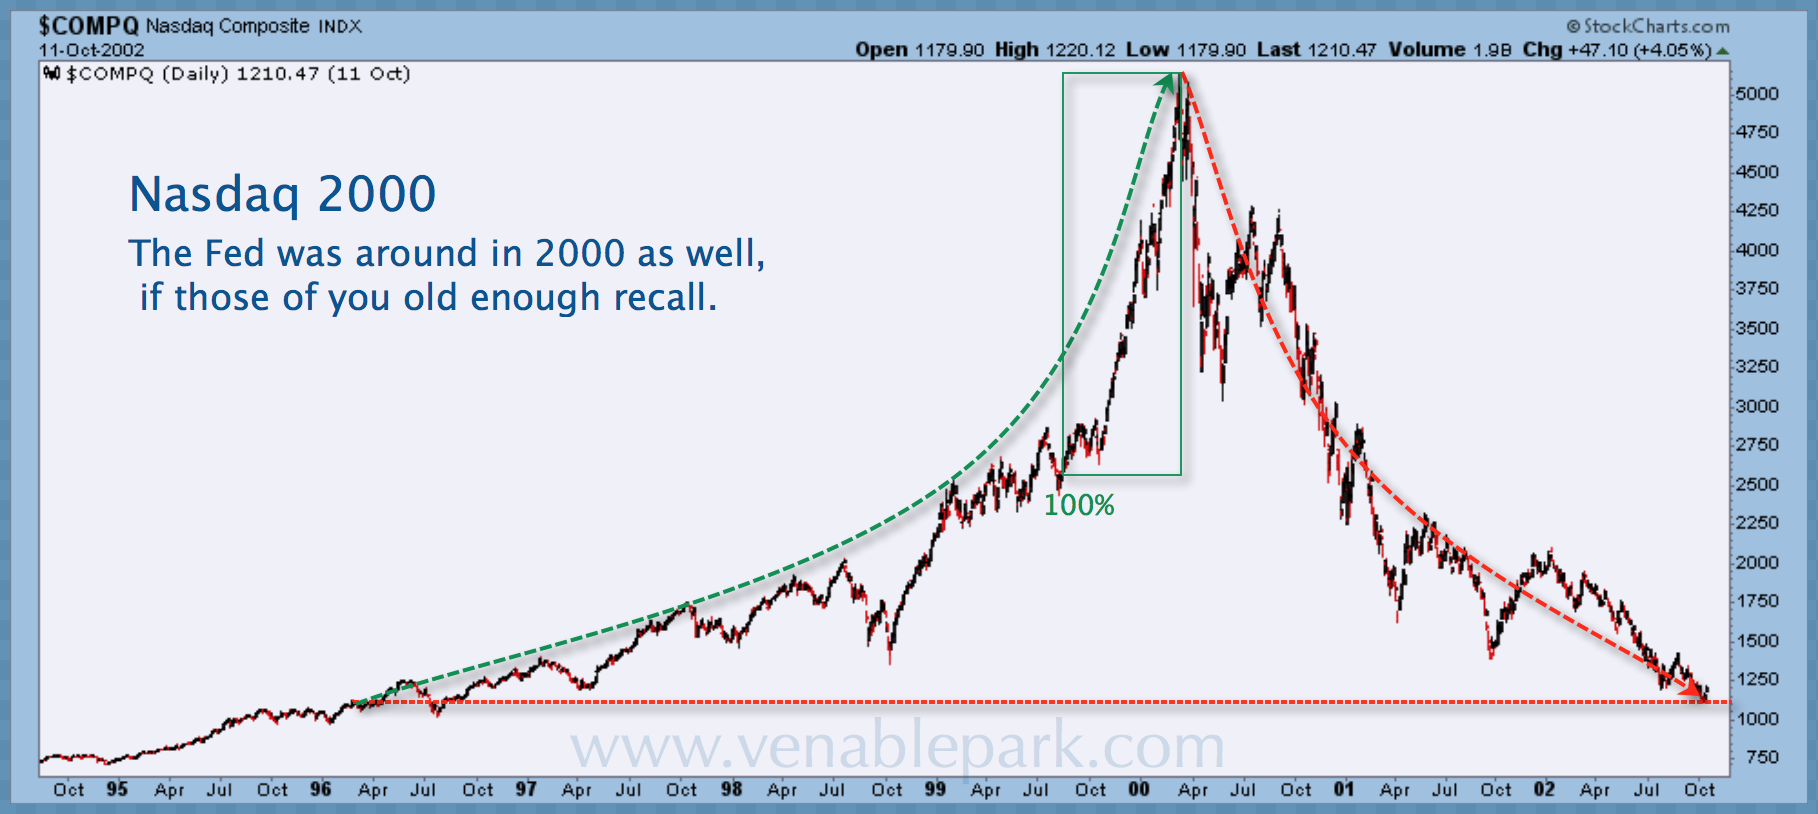
What followed the 2000 episode, of course, was an index loss of 80% over the next 2.5 years and many individual company shares and debt going to zero in bankruptcy, followed by 16 long years before the NASDAQ was able to make its way back to the March 2000 cycle peak.
Historically, far from an anomaly, multi-year recovery periods are the typical aftermath of extreme asset valuation episodes. Sometimes, as after the 1929 Dow peak (when the top was not revisited until 1954) or the Japanese market peak in 1989 (which is still 24% lower today, 31 years later), it takes decades. By then, most original participants have long since sold low, leaving only new believers and the amnesiac piling in with wild abandon. Clearly, we are here again, as record use of margin debt and call options have enabled record trading volumes in 2021. For a surreal glimpse, watch the SPAC dream rap video here.
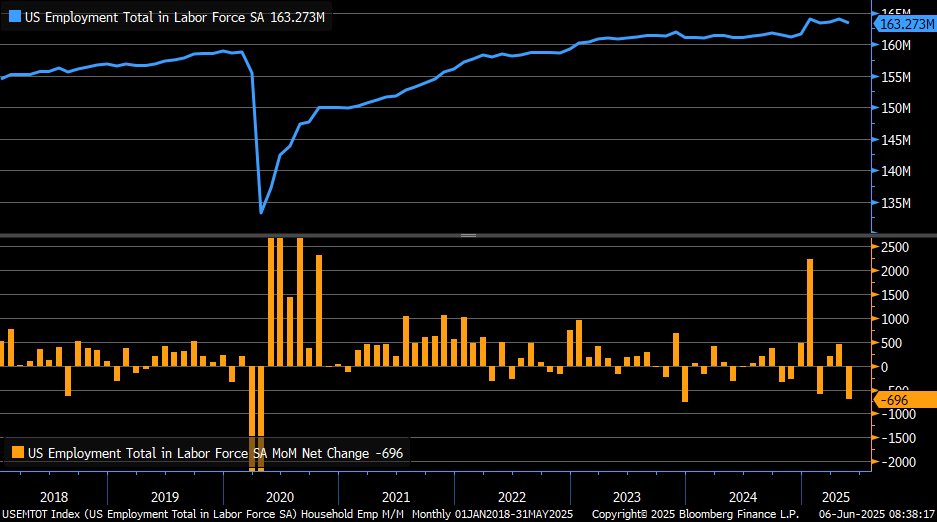
This is the aggregate volume for US stocks today.
Just about 4x its historical average while at record prices.
Insane….. pic.twitter.com/EX4bt87MYX
— Otavio (Tavi) Costa (@TaviCosta) February 9, 2021
Lest any of us be kidding ourselves here, holding equities, REITs, commodities, cryptocurrency, junk debt (or mutual funds and ETFs of them) means that we are along for this ride. And in the end, most of the present participants will end up with zero or negative net gains between the time they buy and the time they sell. John Hussman explains the math in plain-speak:
Understand how extreme current valuations have become. In order to simply touch run-of-the-mill historical valuation norms, the S&P 500 would have to lose somewhere in the range of 65-70% over the completion of this cycle. In that context, it’s worth nothing that a 62% loss would wipe out the entire total return of the S&P 500 over-and-above Treasury bills since the March 2000 peak. Put simply, I would not be terribly surprised if the completion of this cycle shreds away every bit of total return that the S&P 500 has achieved in excess of T-bills since 2000.
There are centuries of human history to warn us of these time-worn mistakes. As J. Paul Getty observed in The Wall Street Investor (1962):
“The seeds of any bust are inherent in any boom that outstrips the pace of whatever solid factors gave it its impetus in the first place. There are no safeguards that can protect the emotional investor from himself. Having bid the market up irrationally, these emotional investors became terrified and unloaded their holdings just as irrationally.”
Asset bubbles are a test of our character and personal discipline. They are a siren song calling even those who are normally prudent to be reckless. Positioning ourselves to minimize losses and capitalize during bursting bubbles requires minimizing our exposure to rising prices before the bust. Few succeed because it takes mental effort and grit to do so. As Jeremy Grantham has observed: “Every career incentive in the industry and every fault of individual human psychology will work toward sucking investors in.”