After peaking a year ago at just over $102, the US dollar against a basket of global currencies sank to $89.20 in early January as the consensus predicted further dollar weakness and commodity strength. Something else happened. The dollar index has strengthened, while the CRB Index–a basket of 19 commodities (39% allocated to energy contracts, 41% to agriculture, 7% to precious metals, and 13% to industrial metals)– has lost its earlier momentum.
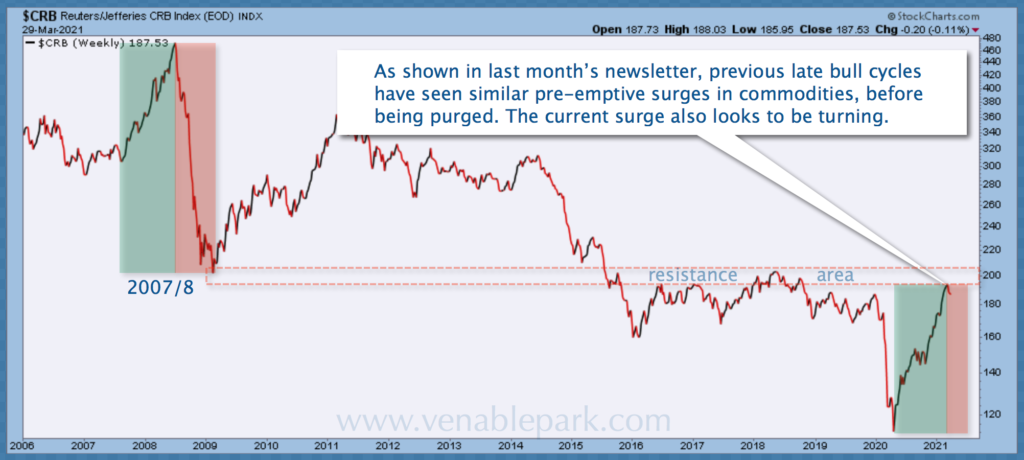
As shown in my partner Cory Venable’s chart of the CRB Index (below since 2006), a speculative financial frenzy drove commodities up 64% from October 2006 to June 2008 (left green band) before prices and interest rates relapsed with the economy into an extended recession and bear market (pink band).

The long-established reality about high prices is that they encourage supply more than demand, and therein lies the seeds of their demise.
Time will tell if the commodity price top is in for this cycle or if further price pressure follows in the months ahead. But with the CRB having already risen 94% between March and January 31, 2021, some robust demand hopes and infrastructure plans have surely been priced in.
The segment below offers a good (and dramatically articulated) market summary as we end Q1 2021.
This week Real Vision’s Roger Hirst uses Refinitiv’s best-in-class data to look at the cracks that have been appearing across the financial landscape after only a small bounce in the US dollar. Many of these issues will be dismissed as one-off events, unconnected by geography or asset. But they could all stem from cheap and abundant dollar liquidity that is showing increasing signs of sensitivity to a small reversal in the fortunes of the dollar. Turkey and Brazil have recently shown their vulnerabilities and the problems of leverage within a family office all represent risks that are lurking under the bonnet.
Here is a direct video link.


