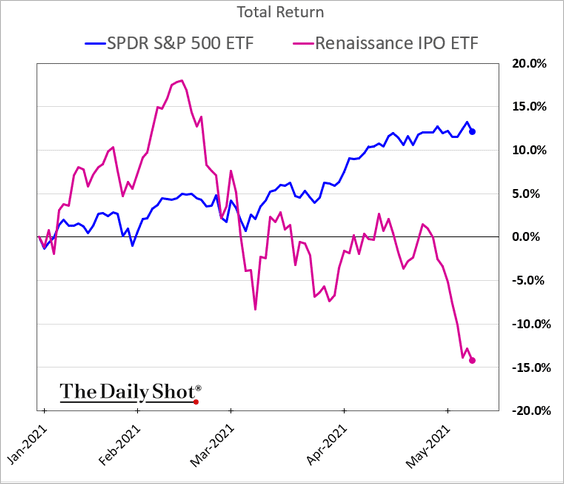
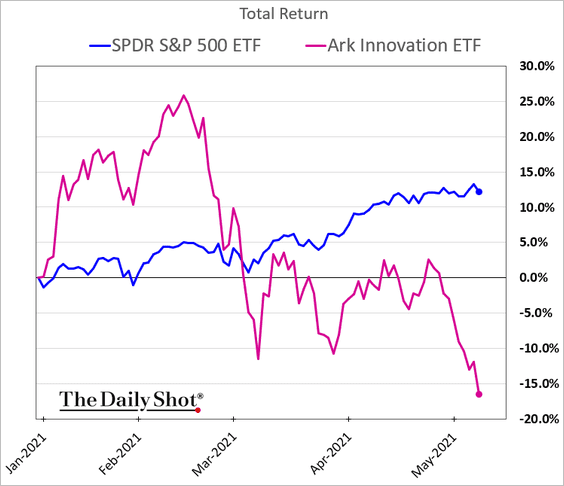
As I observed last Thursday in Coming off the boil?, some leading speculative measurements have waned over the past couple of months, and the trend continues this week with the tech-heavy NASDAQ leading broader markets lower.
The ARK Innovation ETF (shown on the lower left in pink from The DailyShot), all the rage since March 2020, is now -34% from its Feb 16, 2021 peak, and the Rennaissance IPO ETF (lower right in pink–full of crowd favourites like Zoom, Coinbase, Pinterest, Peleton and more) is -26%. Both are shown below relative to the S&P 500 in blue since January.
The small-cap Russell 2000 index that led large-cap stocks higher into March 2021 is now -6.3% from its high and has given back any outperformance against the S&P 500 year to date. It’s a start, anyway.
This could finally be the beginning of the much-needed risk reappraisal or just another consolidation phase. One thing is for sure, just as spreading COVID-19 increases the incidence of mutation, illness and death, drops in extremely overvalued asset prices increase the likelihood of financial contagion among highly levered markets and participants.
Despite all the inflation and growth hype in commodity prices, meanwhile, Treasury prices have so far voted in an opposite direction, with ten-year yields in Canada and America lower today than at the end of April. This has afforded an opportunity to add government bonds on sale with yields three times higher than last summer and with capital gain prospects as the risk-trade moves into liquidation mode. Eventually, there will be a time to reduce Treasuries and use the cash to buy corporate debt and equities once they have mean reverted to investment quality entry points once more. Of course, don’t expect mainstream financial commentators or participants to acknowledge this.
Acknowledge or not, as John Hussman reminds in Counting the Chickens Twice, the fact is that extreme equity valuations have set present owners up for a decade+ during which government bonds are likely to outperform equity returns–just as they did in 52 of the last 84 years (62% of the time):
“…the S&P 500 lagged Treasury bills during the 18-year period from August 1929 to May 1947, and during the 21-year period from November 1961 to October 1982, and during the 13-year period from March 2000 to April 2013. That’s 52 years out of an 84-year span. It’s just what happens when valuations become extreme.
Understanding this requires more math appreciation than the trend-following masses and equities-obsessed financial sector are able to muster, but facts speak for themselves.
Hussman’s chart below plots the price to revenue ratio for the S&P 500 index from 1990 to 2021 (along the lower axis) and the subsequent 10-year annual total return (on the left axis). Here we see that the lower the price multiple paid, the higher the returns over the decade following. Today, with an unprecedented average price of 2.94 x revenue (see arrow), the actual return for stocks is now priced to be -5% annually for the next 10 years. Investment markets are mean teachers for the unaware.


