June’s US consumer price index (including clothes, groceries, restaurant meals, recreational activities and vehicles) increased 5.4% from a year ago, the highest 12-month rate since August 2008. The so-called core price index, which excludes food and energy, rose 4.5% year over year. The seasonally adjusted 0.9% rise in June from May was the largest one-month change since June 2008 (a price peak that cycle).
Accelerating prices for new and used cars (driven by a surge in demand and constricted supply during the pandemic) and gains in prices for lodging and transportation services, including car and truck rentals (reopening components), contributed to the vast majority of the core CPI increase. As shown below, since 2018, core CPI (ex reopening 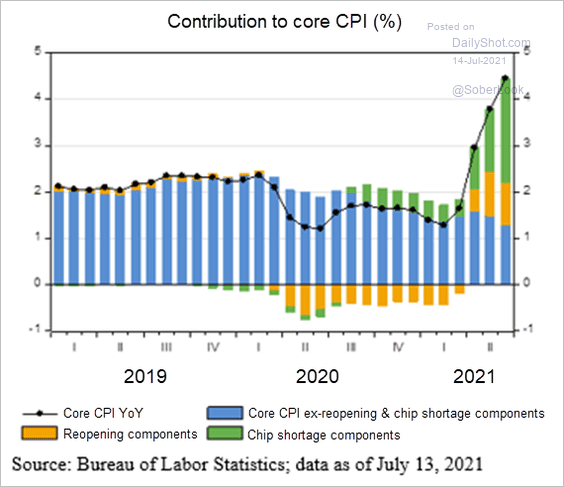 and chip shortage components) has actually been declining since April (blue bars). Lest anyone forget, vehicles are the largest ticket item in the durable goods category, and durable goods are so-named because they last longer than three years. By definition, then, record durable goods demand over the last year is unlikely to be repeated for a few years, at least.
As David Rosenberg noted yesterday, the S&P 500 household durable goods stock composite has sagged nearly nine percent from the nearby highs as service spending picks up:
“…this is important since the former represents a US$2.4-trillion chunk of GDP, or four times the size of the latter. And within the “reopening” subsectors, only retailing and restaurants are behaving well, while office real estate investment trusts, airlines, hotels and casinos have rolled over considerably.”
According to the Conference Board, consumer plans to purchase a vehicle in the next six months remain down year-over-year, and the index of consumer sentiment from Morning 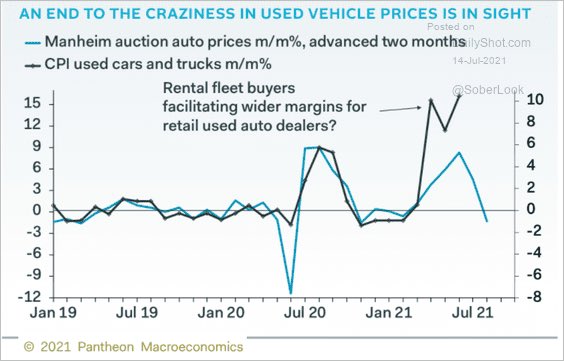 Consult ended June (down 0.6% from May, which ended down 0.9% from April) 12.1% below Feb. 29, 2020 levels. As shown on the left, auto auction data suggest that used vehicle prices are now likely to move lower in the months ahead, as pent-down appetite weighs.
Slowing demand is already evident in weakening economic surprise indices for the world’s largest economies since last summer, as shown below. First-in and out of COVID-19 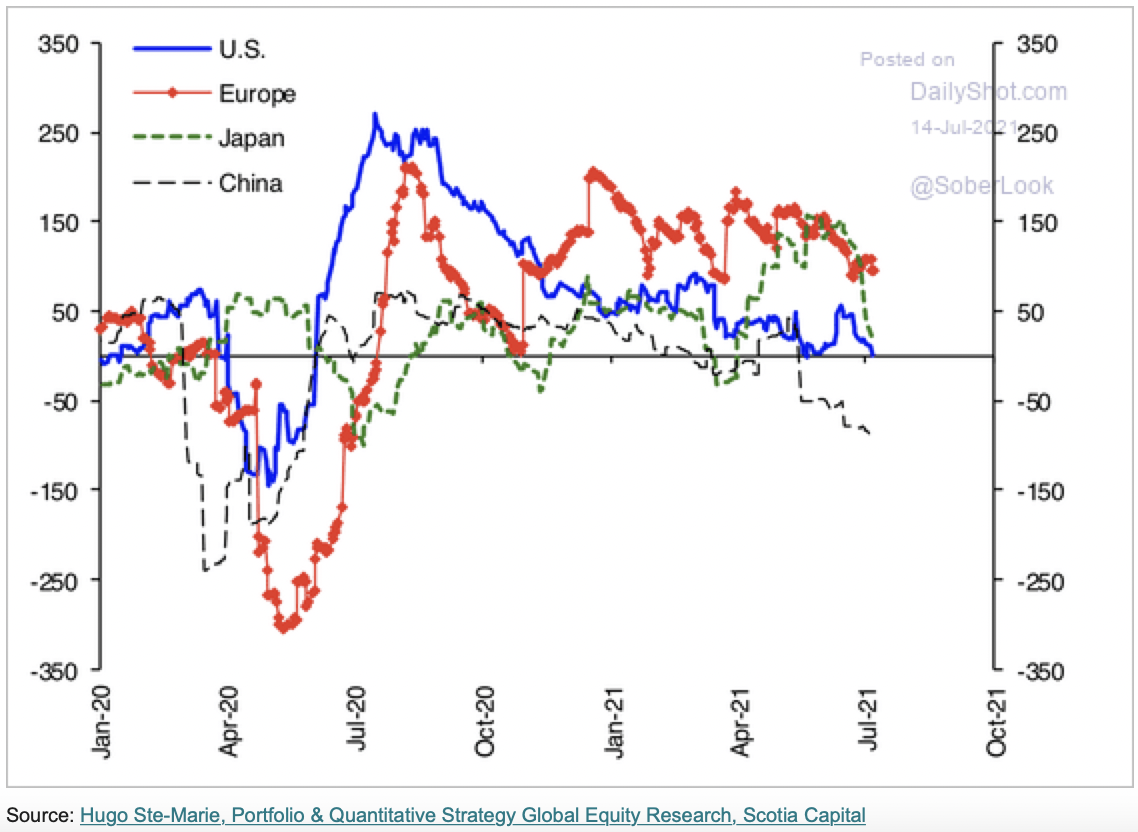 shutdowns, the weakening in China’s economy and price data year-to-date is noteworthy and prompted a surprise decision from China’s central bank (PBOC) last week to try and expand lending by lowering reserve requirements (RRR) for its banks effective July 15. The PBOC is now expected to deliver further cuts in the RRR as pressure on the economy persists, and consumer inflation eases (latest Reuters poll).
As with North American Treasury yields, the 10-year yield in China has been falling again since 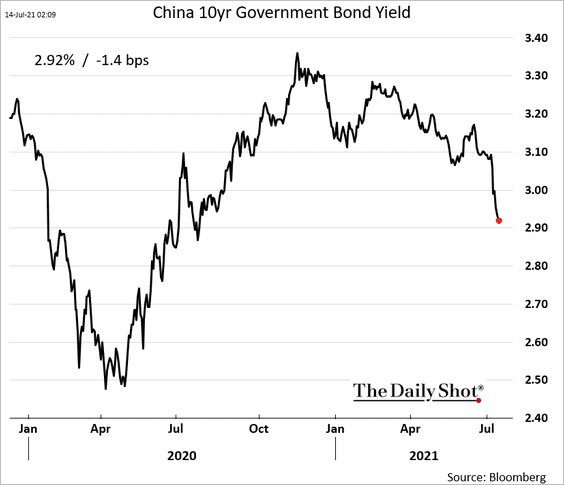 March 2021, and at 2.92%, remains well below its 3.22% level before the global recession hit in early 2020 (shown on the left).
At the same time, lumber continues to deflate with futures at $558 per thousand board feet this morning, down 67% since early May, as demand cools and production expands.
The US dollar has been strengthening against the basket of its major trading partners since May. A rising dollar is deflationary for America but inflationary for those importing its goods. This adds to headwinds for developing economies like Russia, Brazil, Turkey and many others who then find they need to raise interest rates to support their currencies and combat a rising cost of goods–slowing the global economy in the process.
Central banks and record levels of debt have not arrested the economic/financial cycle–what magnified the up will also magnify the down. Understanding this is essential risk management.

