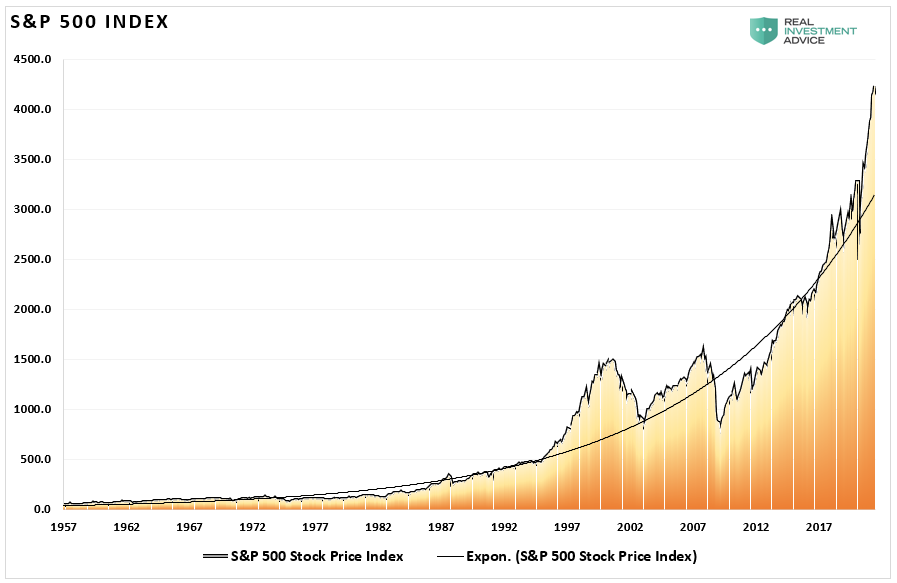
Lance Roberts offers some valuable perspective in Knowledge vs. Experience: Why most investors end up losing, including the non-log chart of the S&P 500 Index below since 1957.  This chart reminds us of just how historically extreme the rise in stock prices has been this cycle, and that the other two times when the index traded far above the exponential trend line–1997 to 2000 and 2003 to 2007–it ended very badly for capital allocations there. Nevertheless, it is classic for humans to extrapolate current trends into the presumption of a new ever-rising paradigm. Here’s Lance:
The chart often gets put into a log scale to reduce the skewness towards large numbers. However, a non-log chart provides a better visual for this explanation. Pay attention to the exponential growth trend line.
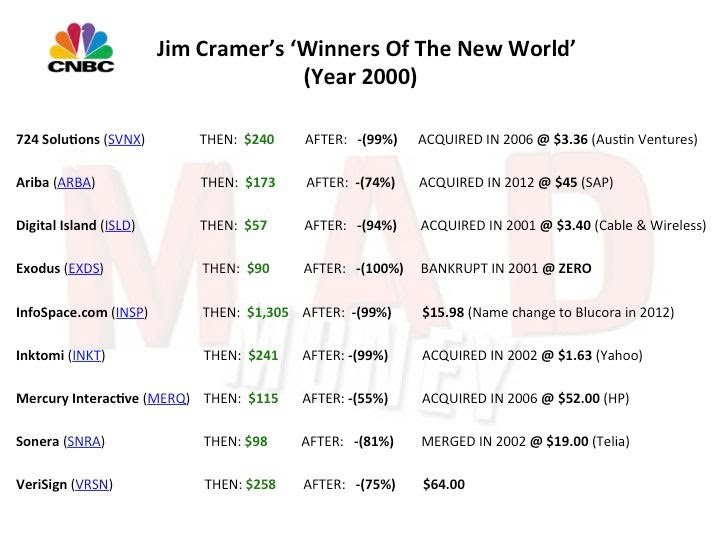
Those with their wits about them will recall that we have seen this movie before. Below is a list of companies that Jim Cramer (then CNBC contributor, now, Mad Money host) touted in 2000 as “winners” for the next decade. Their prices at the supremely confident peak are noted in green, as well as their 55 to 100% declines in the bear market that followed.  I remember all of this like it was yesterday…as does veteran money manager Doug Kass:
At times, the markets can be quite exciting. During the halcyon periods of prosperity and abetted by many (like the financial media who have no dog in the hunt) – traders who act like gamblers are encouraged to ‘play the trend’ and, increasingly do so en masse and as a ‘community.’
History proves this all ends badly and will result (as it did in the early and late 2000s) with an exodus of individual traders/investors out of the markets.
Most of these traders will fail to survive the current market cycle and will not be around in the next cycle.”


