Danielle was a guest with Jim Goddard on Talk Digital Network, talking about recent developments in the world economy and markets. You can listen to an audio clip here.
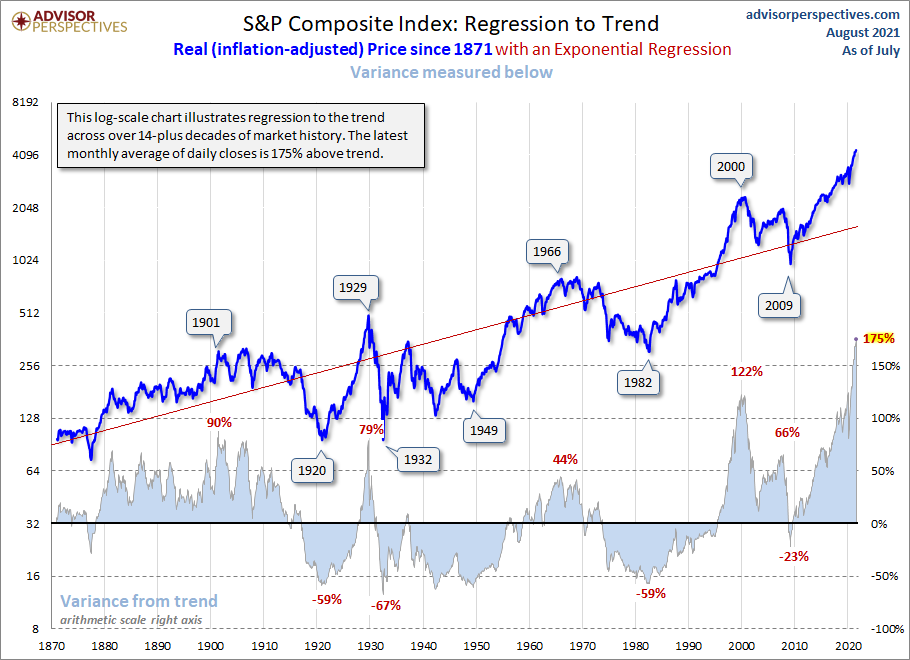
As mentioned in the segment, the chart below shows the real price change in the S&P 500 since 1870 (in blue) along with the 151-year trend in red. With the latest monthly close 175% above the long-term mean, a down cycle that takes prices well below the red line would be in keeping with what followed past secular tops (1901, 1929, 1966, and 2000). Unlike the quick 2009 rebound, however, time below the mean in past cycles has been measured in years as this is needed to correct for the prior period of speculative fervour.


