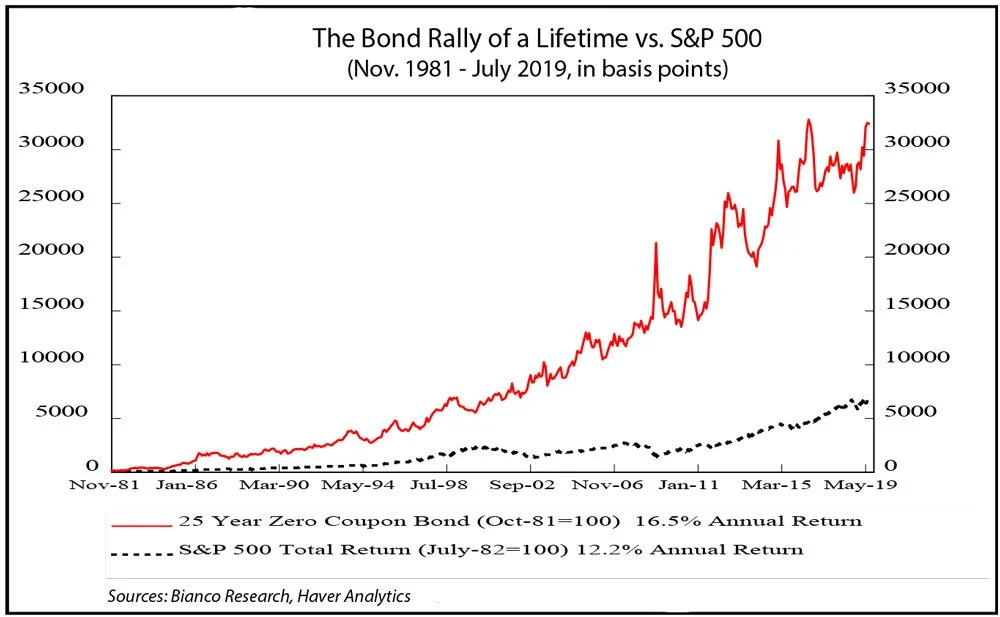
The fact that long Treasuries have kicked the pants off the S&P 500 in total returns over the past 40 years is one of the best-kept secrets in finance. Indeed, looking for a publicly available chart that reveals this is like searching for a needle in a haystack. But then, a so-called investment sector that profits from encouraging the masses to click, borrow, trade and gamble with corporate securities and derivatives have no interest in spreading the truth about investment returns.
Still, math is math, and those with access to the correct historical data and enlightenment can see it. In September 2019, Gary Shilling offered a rare public reveal explaining why he was bullish on long-term bonds. The article included the chart below, which graphs the total return of the 25-year zero-coupon Treasury bond since 1981 (in red) versus the S&P 500 total return (in black) beginning in 1982 (at the start of the longest and strongest secular bull market in history). Here we can see that a dollar invested in the long bond grew to about $32,000 while a dollar invested in the S&P 500 grew to about $6,000.

Total returns always assume that every dollar of income is reinvested as received. So, in real life, any income or principal withdrawn by the owner or paying investment fees will reduce realized compound returns over time.
Extending from the chart above, Treasuries continued to outperform stocks dramatically from July 2019 to August 2020. Stocks had a better short-term gain from late 2020 to last month, but Treasury’s have retaken the lead since. With stocks presently the most over-valued, over-hyped and over-allocated in history, Treasury returns are due to run leaps and bounds ahead of equities once more. It is a tragedy that so few people understand these basic facts.


