With more than 70% of its 3600 c0nstituent companies down more than 20% from their highs, the sentiment-leading NASDAQ index is now trading below its 50-, 100–, and 200-day moving averages for the first time since March 2020.
The 2020 market plunge was abrupt but too short and shallow to correct for cyclical extremes in valuations and animal spirits. A retest was always coming. The Federal Reserve-inspired market excesses of the last two years have been breathtaking. If the recent weakness is the lasting trend change, the downside prospects are also spectacular.
Lance Roberts lays out the reality from present levels in A 50% Decline Will Only be a Correction:
Every bear market in history has an initial decline, a reflexive rally, then a protracted decline which reverts market excesses. Investors never know where they are in the process until the rally’s completion from the initial fall.
…When you realize that a 50-percent decline in prices would still maintain the “bullish trend” of the market, it just shows how exacerbated markets are due to a decade of monetary interventions.
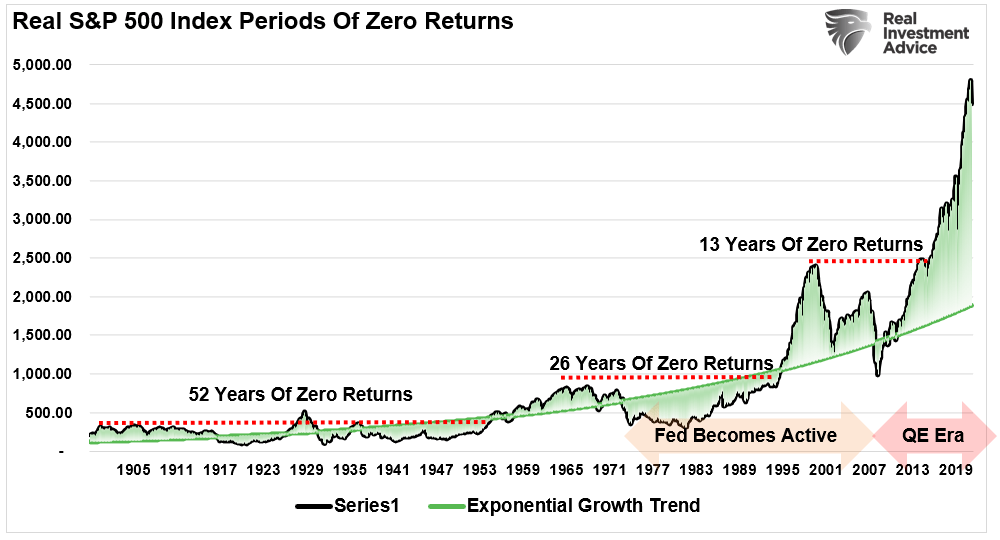
Lance offers the 40,000-foot view in this chart of the S&P exponential growth trend (green line) versus price (black) since 1900 and notes that other lesser periods of overshoot above-trend have always been followed by very long periods of no returns. Just the facts, folks.