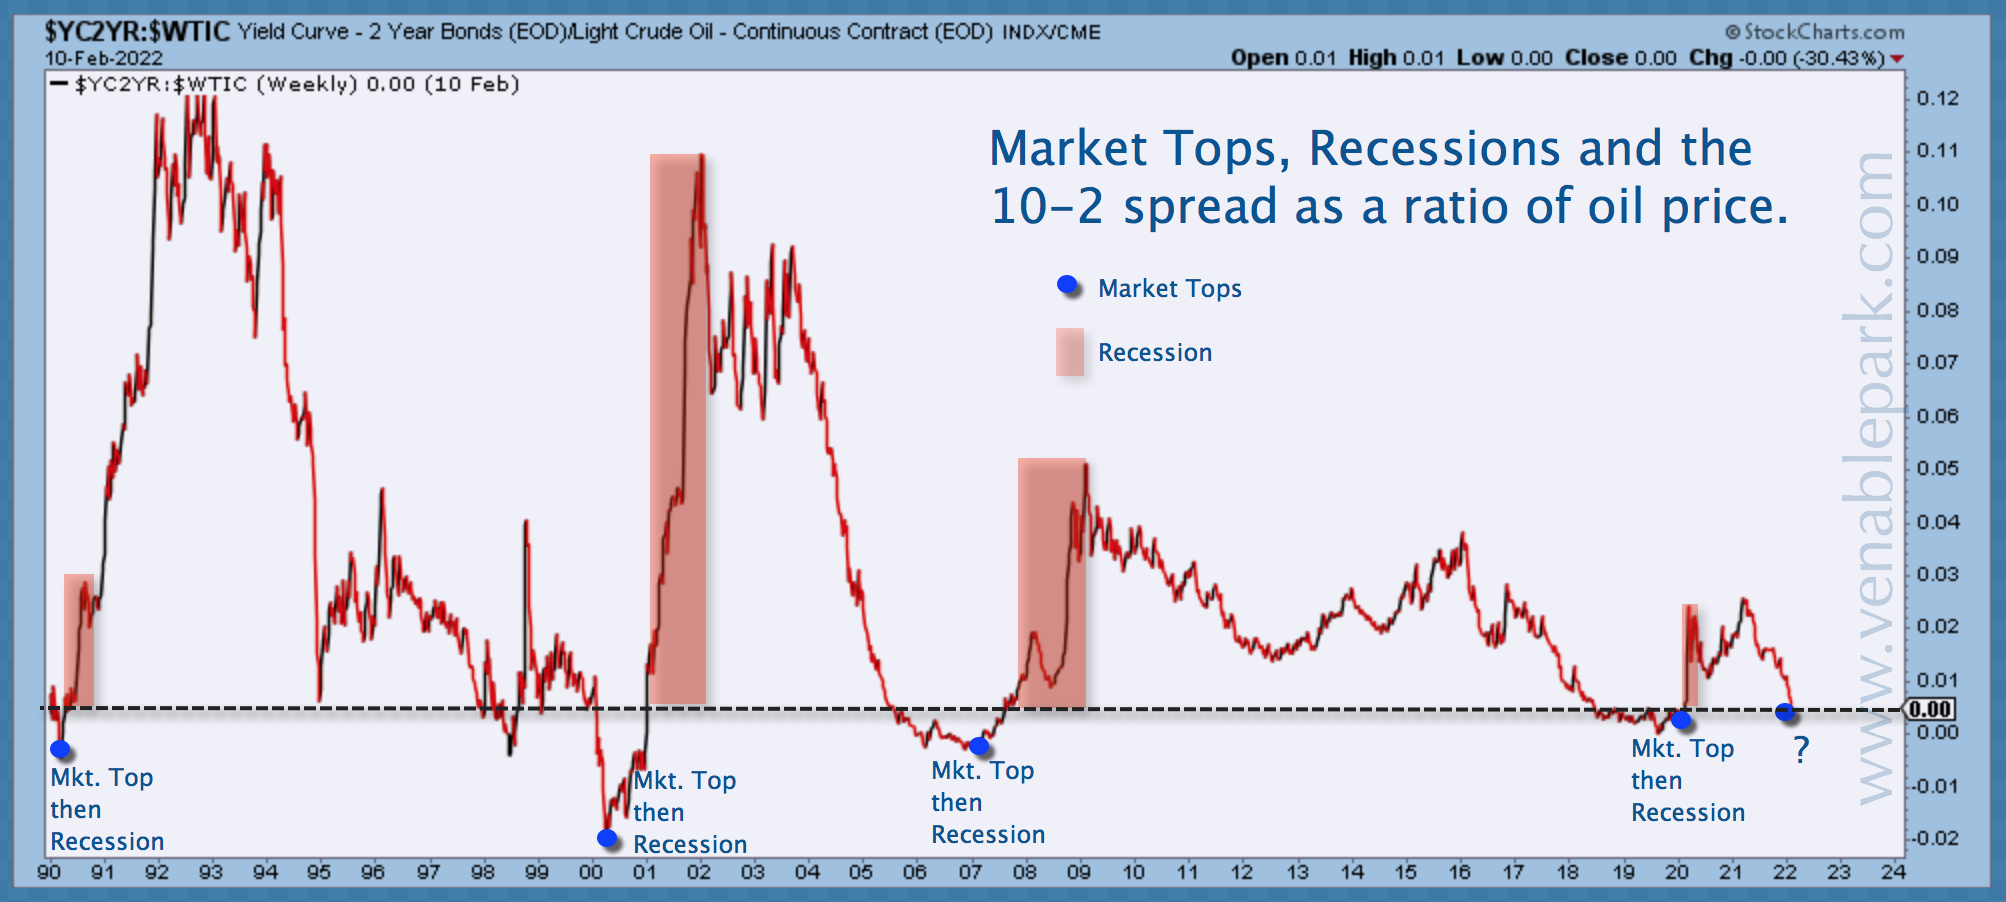
This morning, the spread between the ten and two-year U.S Treasury yields has narrowed to just .405%, and oil (WTI) has moved above $92.
As shown below in my partner Cory Venable’s chart since 1990, when the ratio of these two financial indicators fell to zero (yields compressing faster than oil price is rising) in 1990, 2000, 2007 and 2020, a bear market and recession were in process.

So far, the Dow is off 5.6% from the highs (transports are -12.0%), the S&P 500 is -7.8%. Ex-energy and financials, the S&P 500 is near -10%.
The TSX is flat thanks to its 45% concentration in late-cycle holdouts financials and petrochemicals. Word to the wise, this late-cycle outperformance is not long for this world: petrochemicals, commodities, materials, tech, and financials are all the worst-performing sectors in the slowing growth and inflation phase now unfolding. The Nasdaq is -14%, and the economically sensitive Russell 2000 is -16.9%–the same level it was at the start of 2021.
Meanwhile, retail investors plowed a record $34.1 billion into U.S. equity funds last week, further reducing their already historically minuscule allocations to bonds and cash. Global fund flows show similar trends.
At the onset of the next cyclical bear market of historic proportions, retail is once more long on debt and overvalued assets but short on dry powder.
Doing the opposite of the crowd is a critical component of longer-term financial success and investment optionality.


