The U.S. Federal Reserve finally hiked its policy rate by .25% yesterday, its first increase since 2018. With rates now in the barely positive .25-.50% nominal range, the plan is to hike six more times toward 2% by year-end. At their meeting in May, they hope to start running down their holdings of nearly $9 trillion in QE bonds accumulated since 2008.
The Bank of England followed suit today, announcing its third consecutive .25% increase today (overnight rate now at .75%). The European Central Bank hasn’t increased rates since Europe’s 2011 financial crisis but says it might end its QE bond-buying program during the third quarter as the first step of monetary tightening efforts.
The political pressure to hike rates has leapt with the surge in shelter, food and fossil fuel costs. To be sure, food and fuel inflation have intensified with Russia’s invasion of Ukraine. Still, the cost of living pressure was spiking well before that, thanks to ultra-loose fiscal and monetary policies, which elevated debt-fueled consumption and speculation in financial assets, housing and commodities over the past two years.
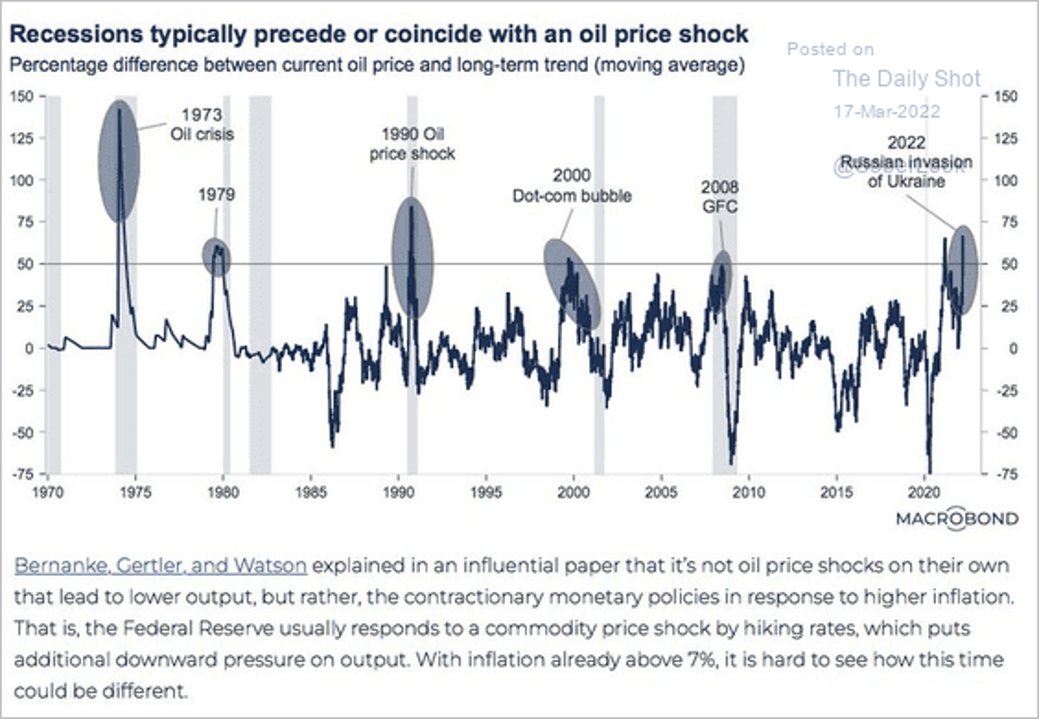
As shown below, since 1970, responding late to cost of living pressures, central banks hiked rates during past oil price shocks, each time accelerating the onset of an incoming recession (grey bars). This time they are trying to hike rates amid a confluence of pent-down global demand amid contracting fiscal forces, record debt, a war in the world’s breadbasket, leaping environmental problems and yet another aggressive COVID-19 variant surge.
 Anticipating the tightening intentions of central banks, bond markets globally have already increased the cost of capital significantly (yields rise as prices fall). At the same time, real incomes (spending power) have contracted (costs rising faster than wages), and corporate profit revisions are negative for the first time since 2020.
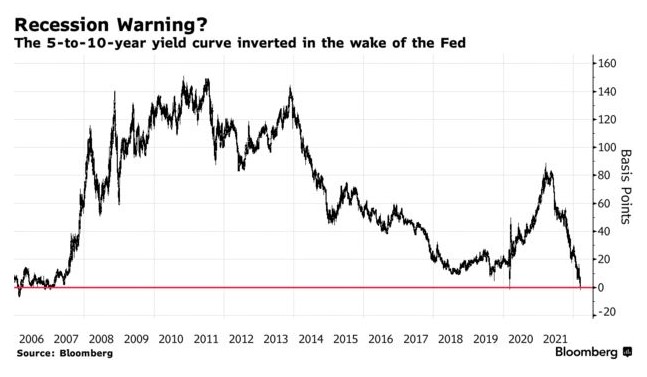
While stocks initially leapt on the Fed’s delusional aspirational talk of a strong economy yesterday, the facts are much different. As Fed Chair Powell talked up his thread bear monetary tool kit, five and 10-year Treasury spreads inverted in their third recessionary signal since 2006 (shown below). The two and 10-year Treasury yield curve slumped to a new cycle low of .20%. Central banks want to raise rates to have some room to cut again as the economy slips. Unfortunately, the time for doing so was last year and their compounding policy errors only increase the downside from here. While violent daily stock swings continue to suck in retail buyers, an ongoing bear market has been unfolding since the economically-sensitive Russell 2000 small-cap index peaked over a year ago in January of 2021, large-cap stocks and Canada’s TSX in November 2021.
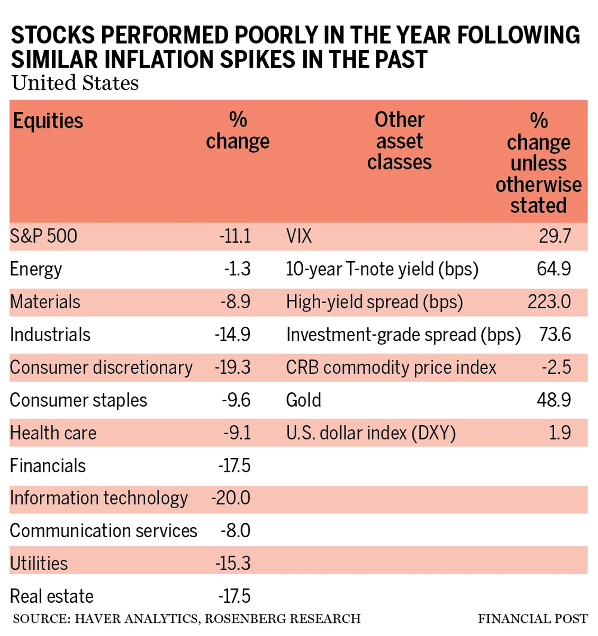
Since most financial managers and funds have a mandate to remain fully invested in risk assets (so they can keep collecting the richest fees), their talk is all about ‘relative performance.’ But virtually all asset classes lose value in bear markets, especially following periods like the last few years where valuations have become wildly untethered from positive return prospects. The table below shows the average performance for all equity sectors in the year following previous inflation spikes. While it is typical for ‘safe havens’ to sell off initially too, Treasury bonds, bullion, and the U.S. dollar are about the only assets that rebound in price as the rest make their way to a bear market low some six months before the recession finally ends.
 Cash is the most prized commodity because of its optionality for buying when the masses are liquidating. But, as usual, ‘cash is trash’ brain-washing by the product-selling finance sector means few will have much of it at the ready.


