A not-so-stealth bear market continues globally even as a handful of late-cycle holdouts prop up broad indices and mask the breadth of constituent carnage.
As our cycle analysis suggested would happen, individual companies and sectors are giving back their rebound from the March 2020 bounce. And for a good reason. Unprecedented fiscal and monetary support inspired market elation over the past two years. Both are now staging an abrupt retreat.
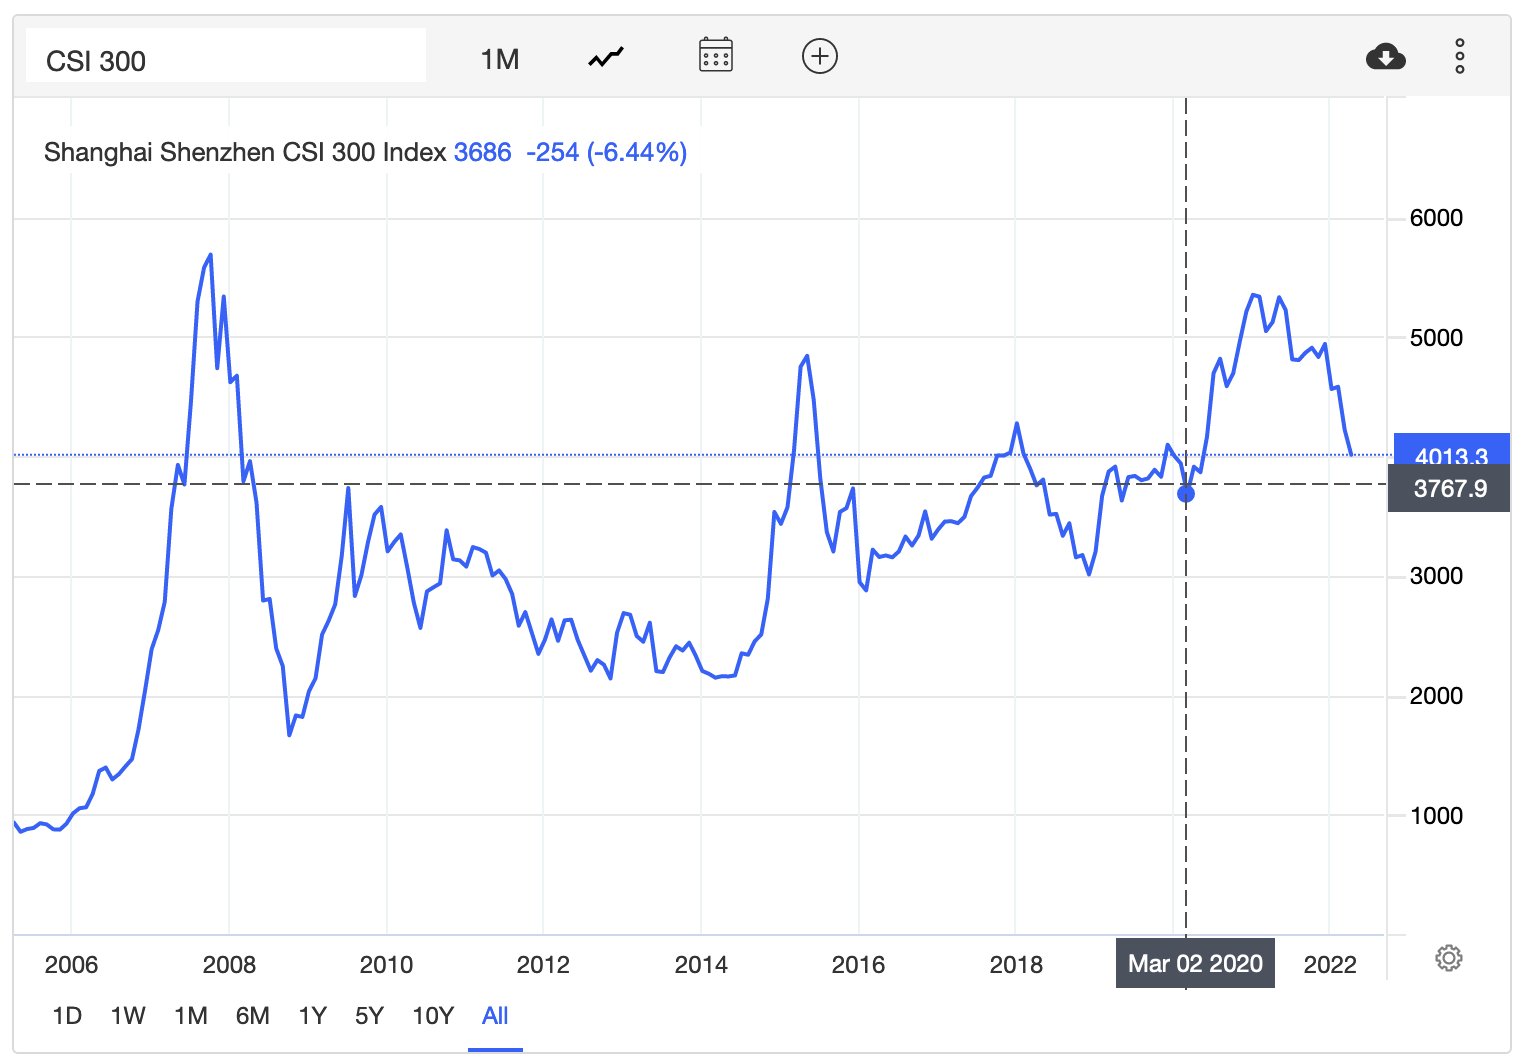
In addition, ongoing weakness in China–the world’s second-largest economy and most significant buyer of raw materials–is exerting downward pressure on global growth and inflation. China’s Sales Manager Index (covering manufacturing and services) contracted in April to 49.2–a 22-month-low. As GDP growth estimates tumble, China’s CSI stock index (below since 2005) has fallen over 16% year-to-date and 23% since February 2021. Now, just 6% above its March 2020 low, the stock index remains 40% below where the China/commodity speculative frenzy peaked last cycle in October 2008.
The U.S. stock rage was all about FAANGs, and recent price action is finally fulfilling its over-valued promise there as well:
-
- Facebook (now Meta)-50% since August 2021
- Apple -8% since January 2022
- Amazon -21% since November 2021
- Netflix -68% since October 2021
- Google -18% since February 2022
The eight most expensive stocks in the NASDAQ market cap are all retreating: Apple (-8%), Microsoft (-20%), Amazon (-21%), Tesla (-18%), Google (-18%), NVIDIA (-42%), Meta (-50%), so far, taking the index down 18% from its November 2021 high. Next week, we will hear first quarter 2022 earnings reports from the three companies that make up 30% of the NASDAQ index market capitalization: Apple (making up 12.5%), Microsoft (9.8%) and Amazon (7.4%). Any disappointment or whispers pose a magnified downside risk for markets (the three companies are also the largest weights in the S&P 500, making up 16%). The majority of stocks in the indices are already down more than 20%, and eventually, bear markets come for the generals.
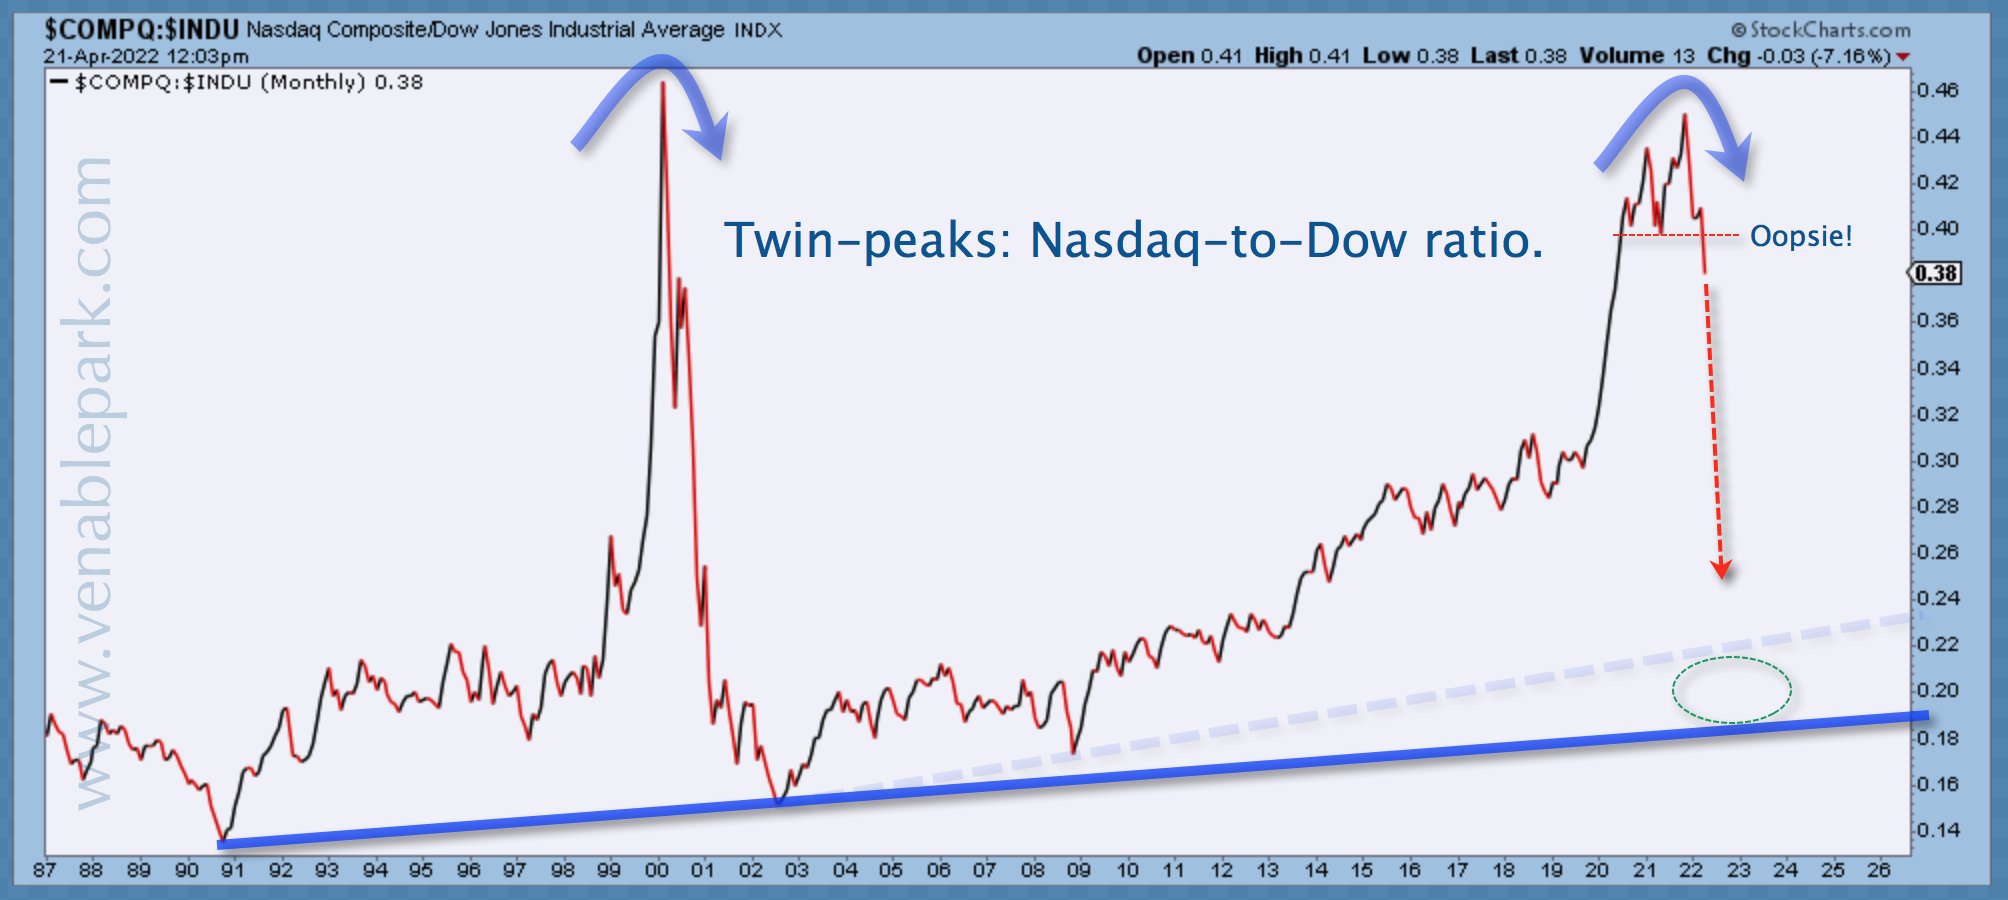
The chart below from my partner Cory Venable shows the NASDAQ to DOW 30 Index price ratio since 1987. Symmetry with the 2000 tech bubble top is pretty incredible to behold. And the recent retreat in the ratio below.40, warns of downside yet to come.
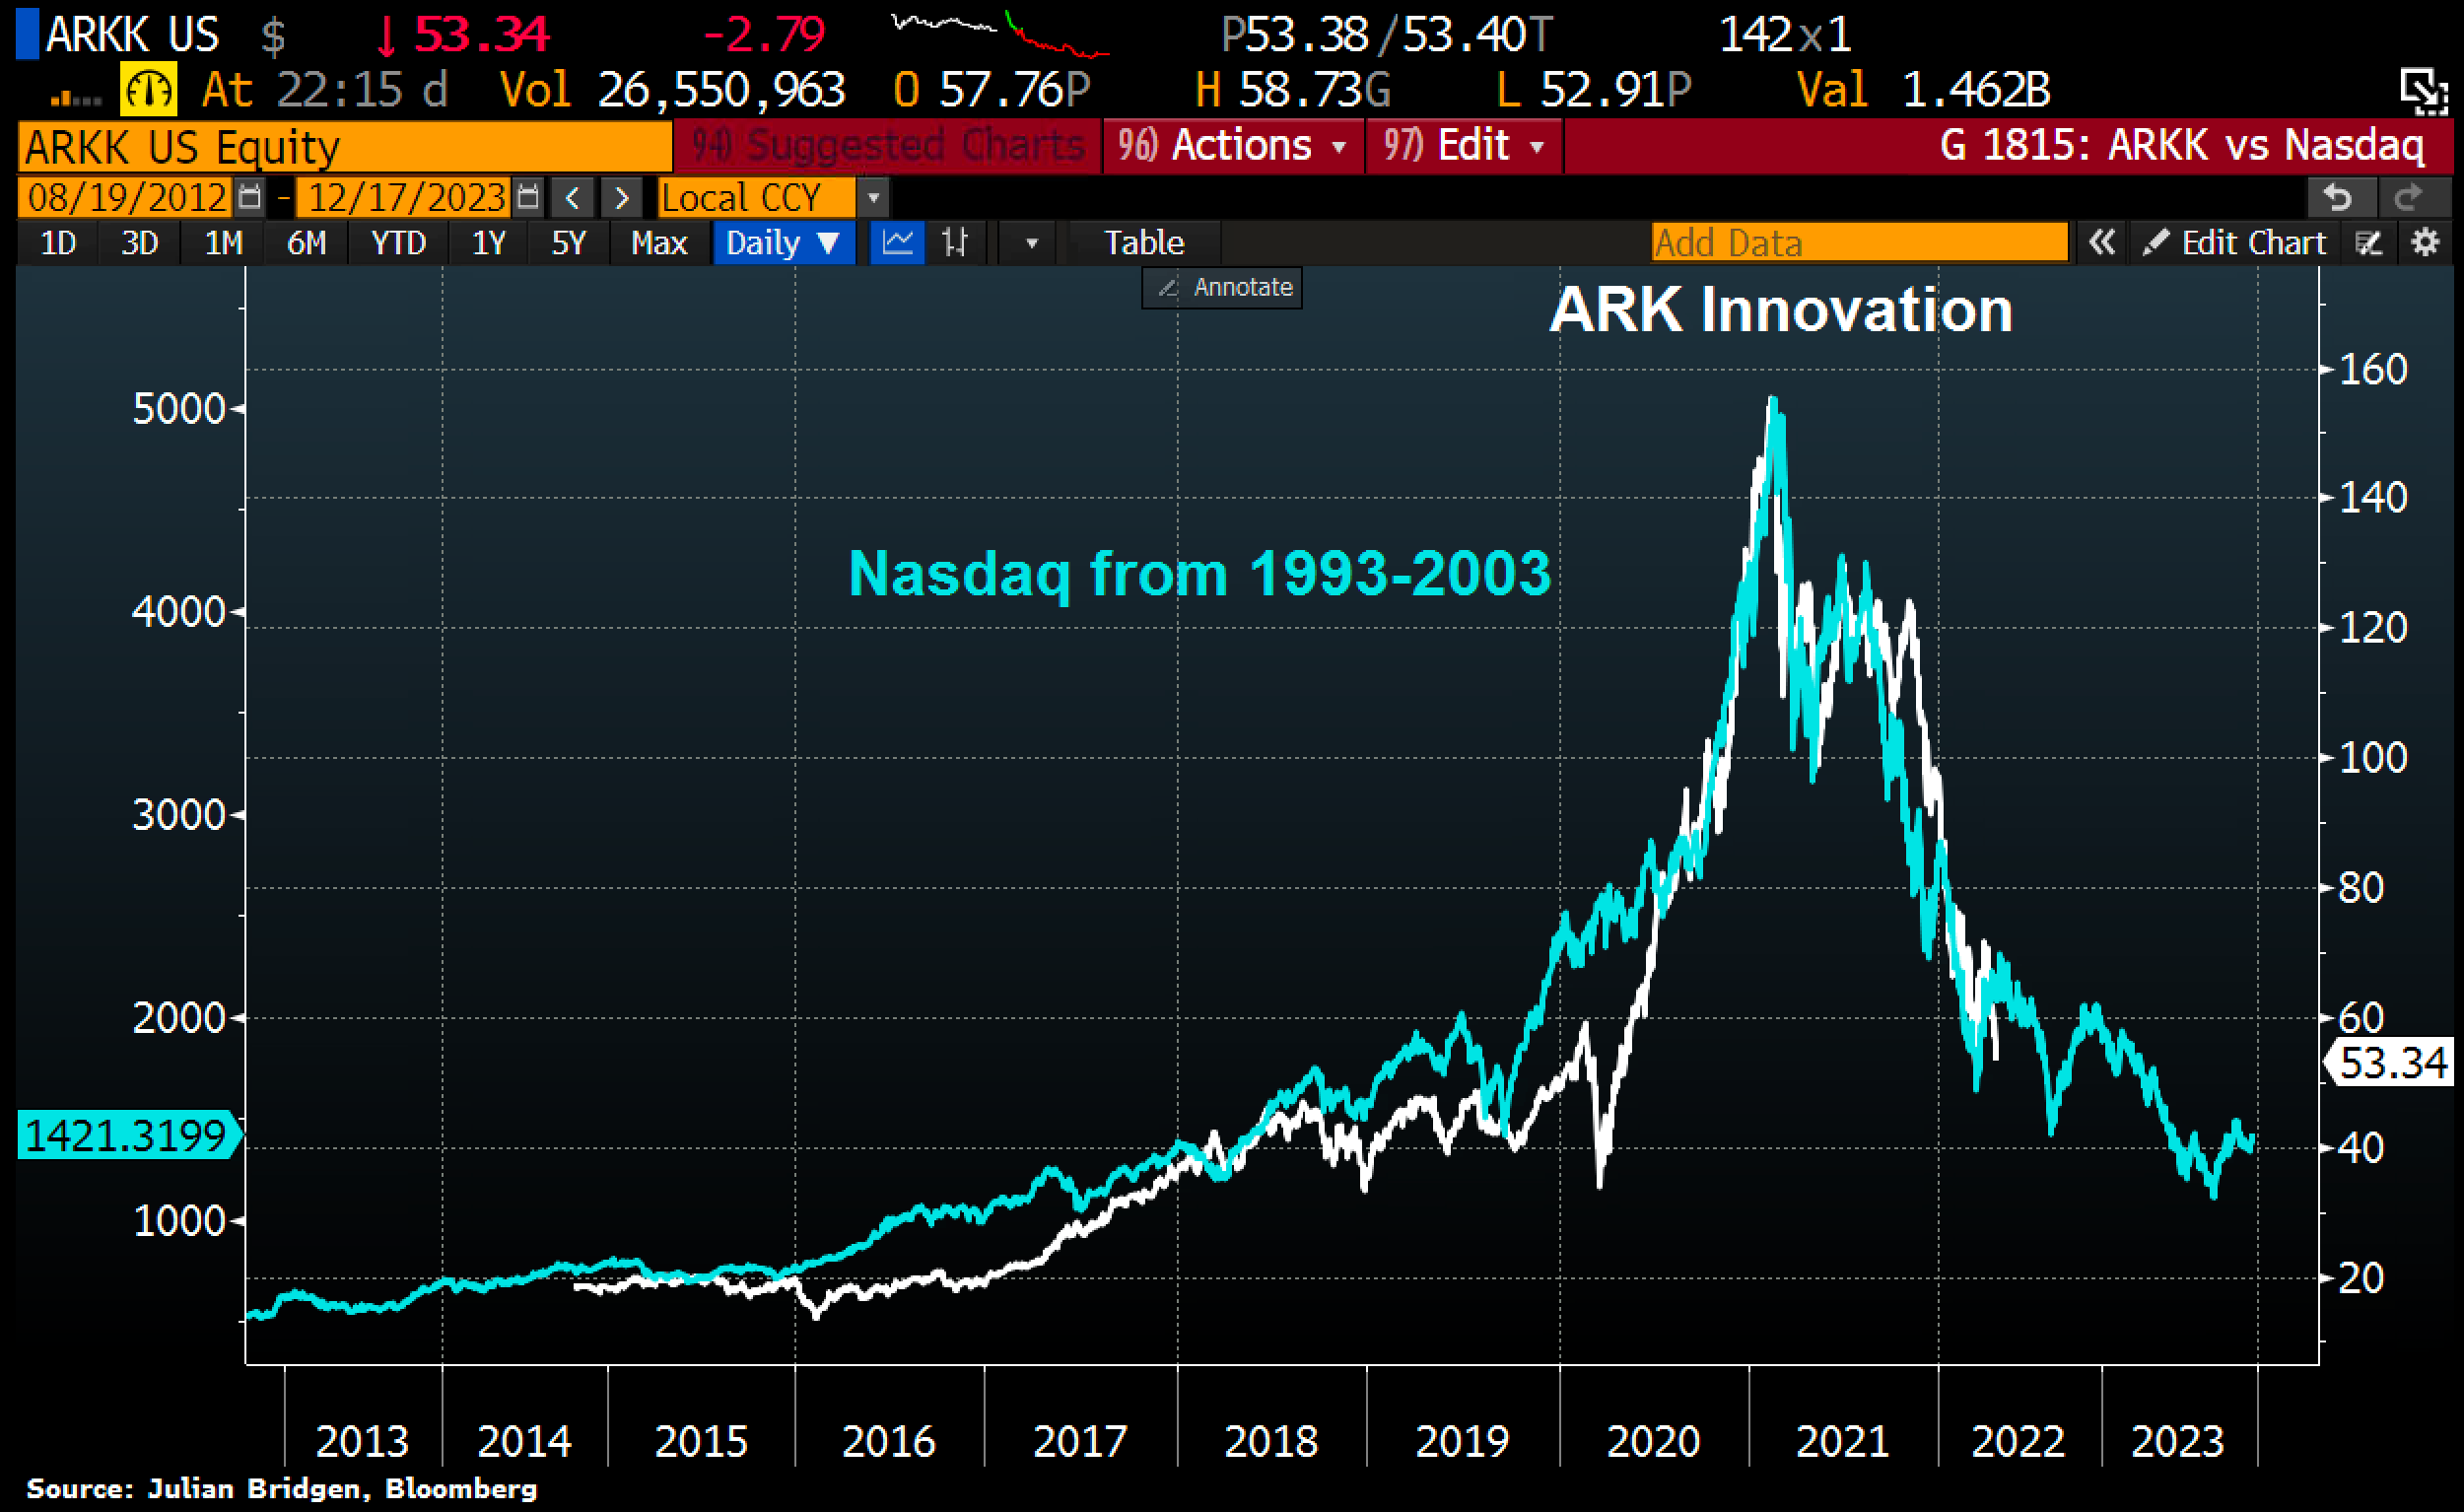
Already, bubble stars like Canada’s SHOPIFY is -73% from its high last November, and the ARRK Innovation fund (-66%) has given back all of its gains since February of 2020. As shown below, courtesy of Holger Zschaepitz, ARK’s price (in white) is tracking closely with the NASDAQ’s moves from 1993 to 2003 (in blue)–funny how price (investor behaviour) cycles rhyme. 
History warns that financials and fossil fuel companies are last to the bear market drubbing, but join it they will. So far, the Canadian financial index (XFN) is off just over 9%, the US financials -12% and Canada’s oil and gas companies (XEG) -6%…and counting.
Over the last two months, talk of aggressive rate hikes has caused bonds to suffer their worst bear market in 40 years. Unlike other assets, though, the highest quality bonds pay interest semi-annually and return the principal on due dates. They’re also about the only assets that rise in price as the economy, equity, commodity and corporate debt markets move from bubbles through bust, and central banks lower rates encore.


