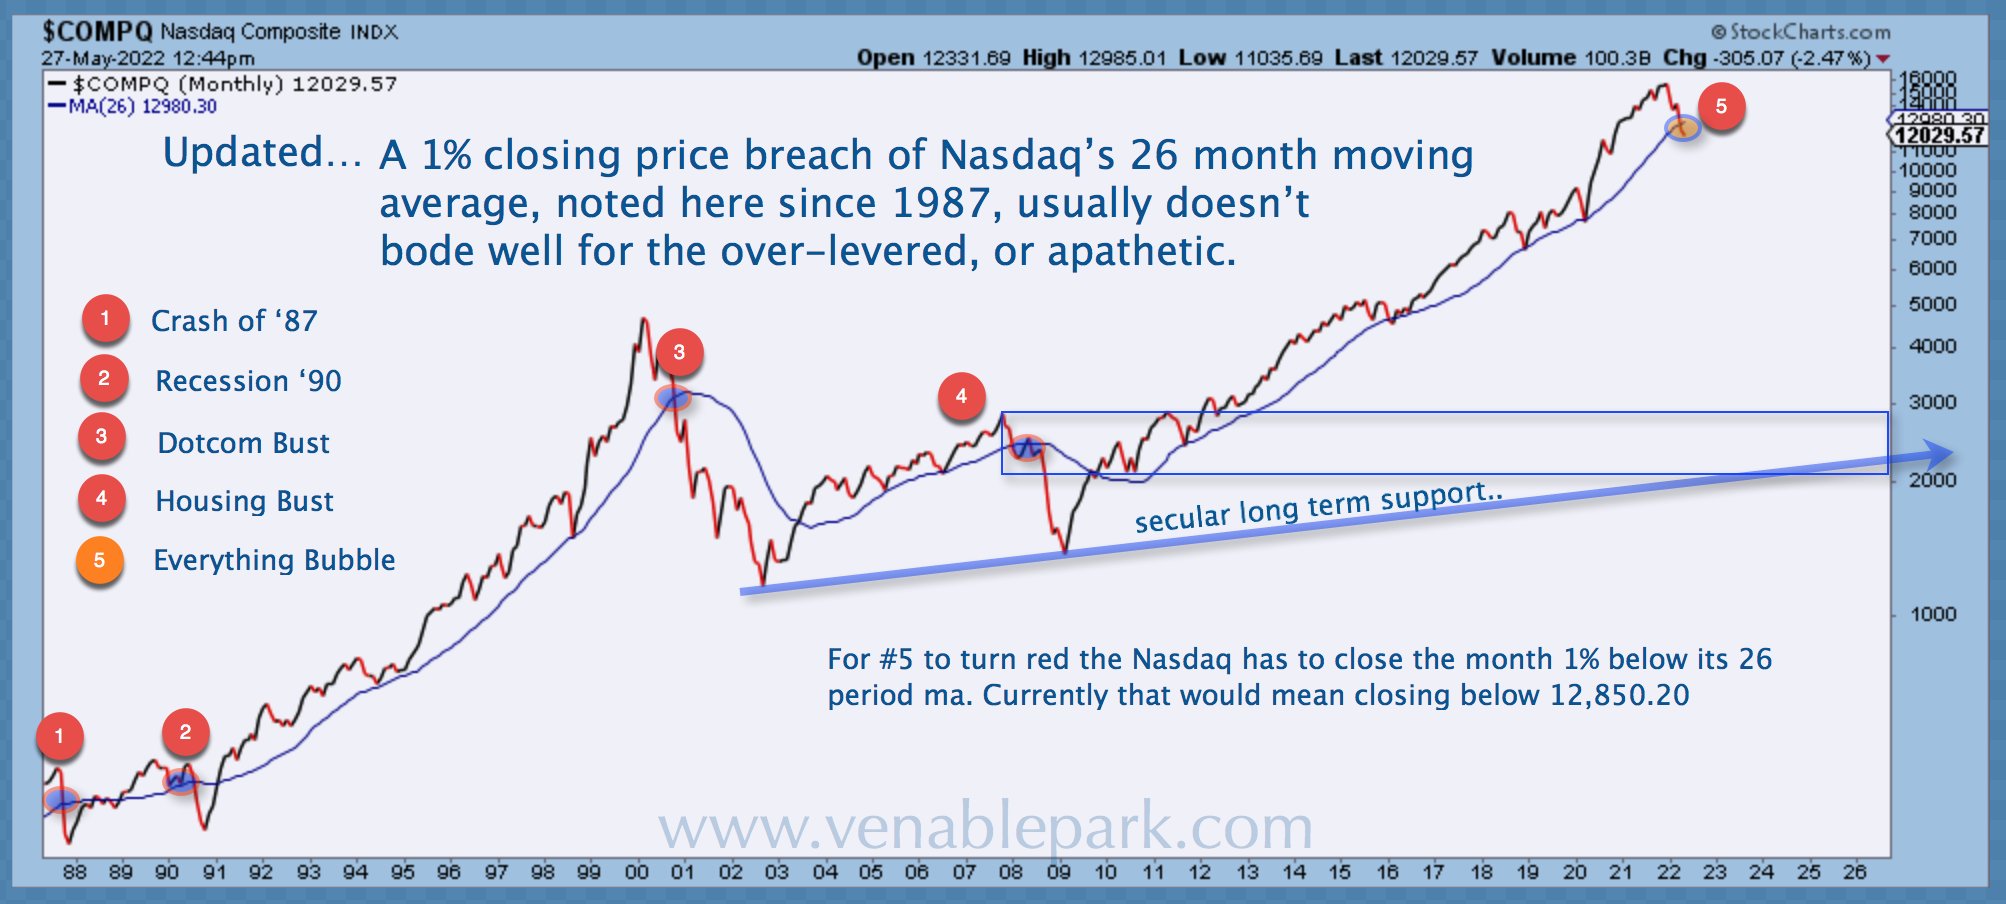
Yesterday’s month-end close for the NASDAQ Composite Index of 12,081 officially breached its 26-month moving average by more than 1%.
My partner Cory Venable’s chart below highlights that this was the 5th such breach on a monthly close since 1987. The previous four occurrences marked recessions and major bear markets. The last two, 2000-02 and 2007-09, saw the tech-heavy index lose 77% and 54%, respectively, while the economy and broader markets tumbled for the ride.
Over the last six months, the NASDAQ is -25%, the S&P 500 -14%, and Canada’s TSX just -5.8%.
Since 1929, when the economy was not in recession, the average bear market decline for the S&P 500 was 29% over 12 months. When the economy was in recession, the average decline was 42% over 16 months (hat tip: Charlie Bilello).
As in 2000 and 2007, extreme leverage and speculative activity over the last few years have increased the likelihood of a deeper than average loss cycle and recession.
Buy the dip habits remain deeply engrained and have not yet given way to the capitulation selling of bear market bottoms.
Speculative interest (CBOT), so far, remains net short bonds and net long equities. Retail equity outflows from mutual funds have amounted to just 0.3% of assets under management compared with an average of 2.6% during previous bear markets (Barclays data). Panicked liquidation is not yet happening, but it will.