Komal Sri Kumar, Sri-Kumar Global Strategies president, on Loretta Mester’s recent comments on the federal funds rate, what the yield curve tells investors, and more. Here is a direct video link.
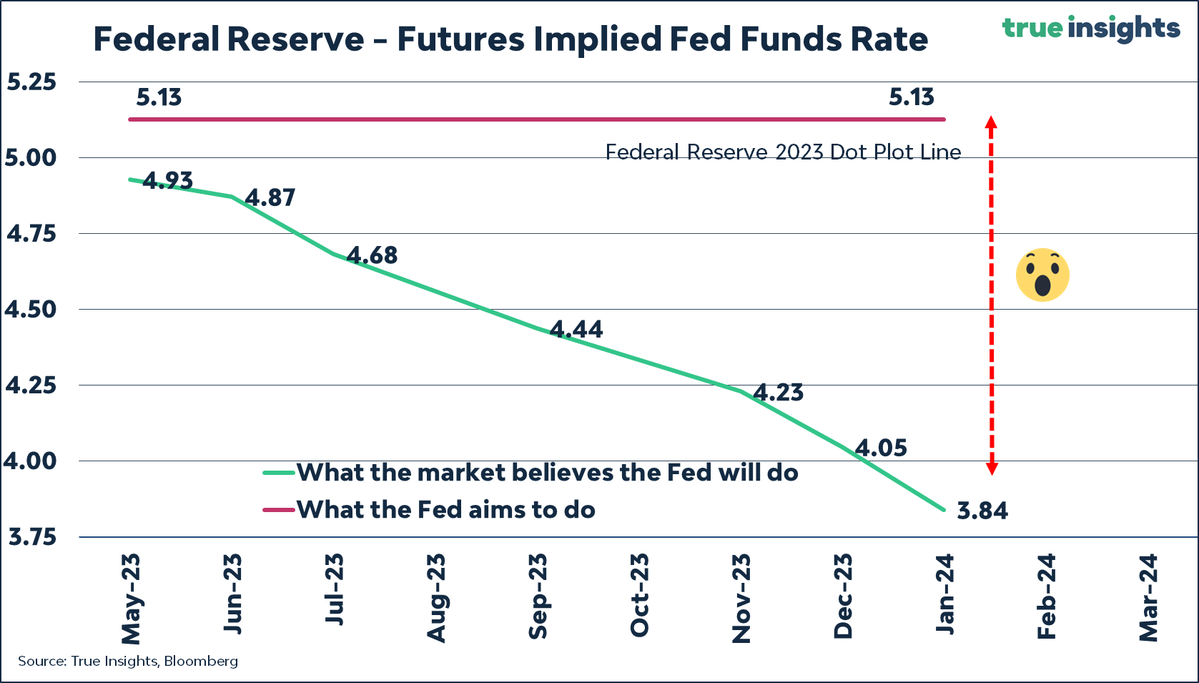
The chart below (courtesy of True Insights) shows the gap between the US Fed’s stated expectations for a 5.13% policy rate through the end of this year (red line) and what the Fed fund futures market is now pricing–cuts starting in June and 3.84% by January 2024 (green line). We are about to find out which one has the correct trend. In the meantime, government bond yields have been making lower lows since last October (prices rising), so fixed mortgage rates should be heading lower too.
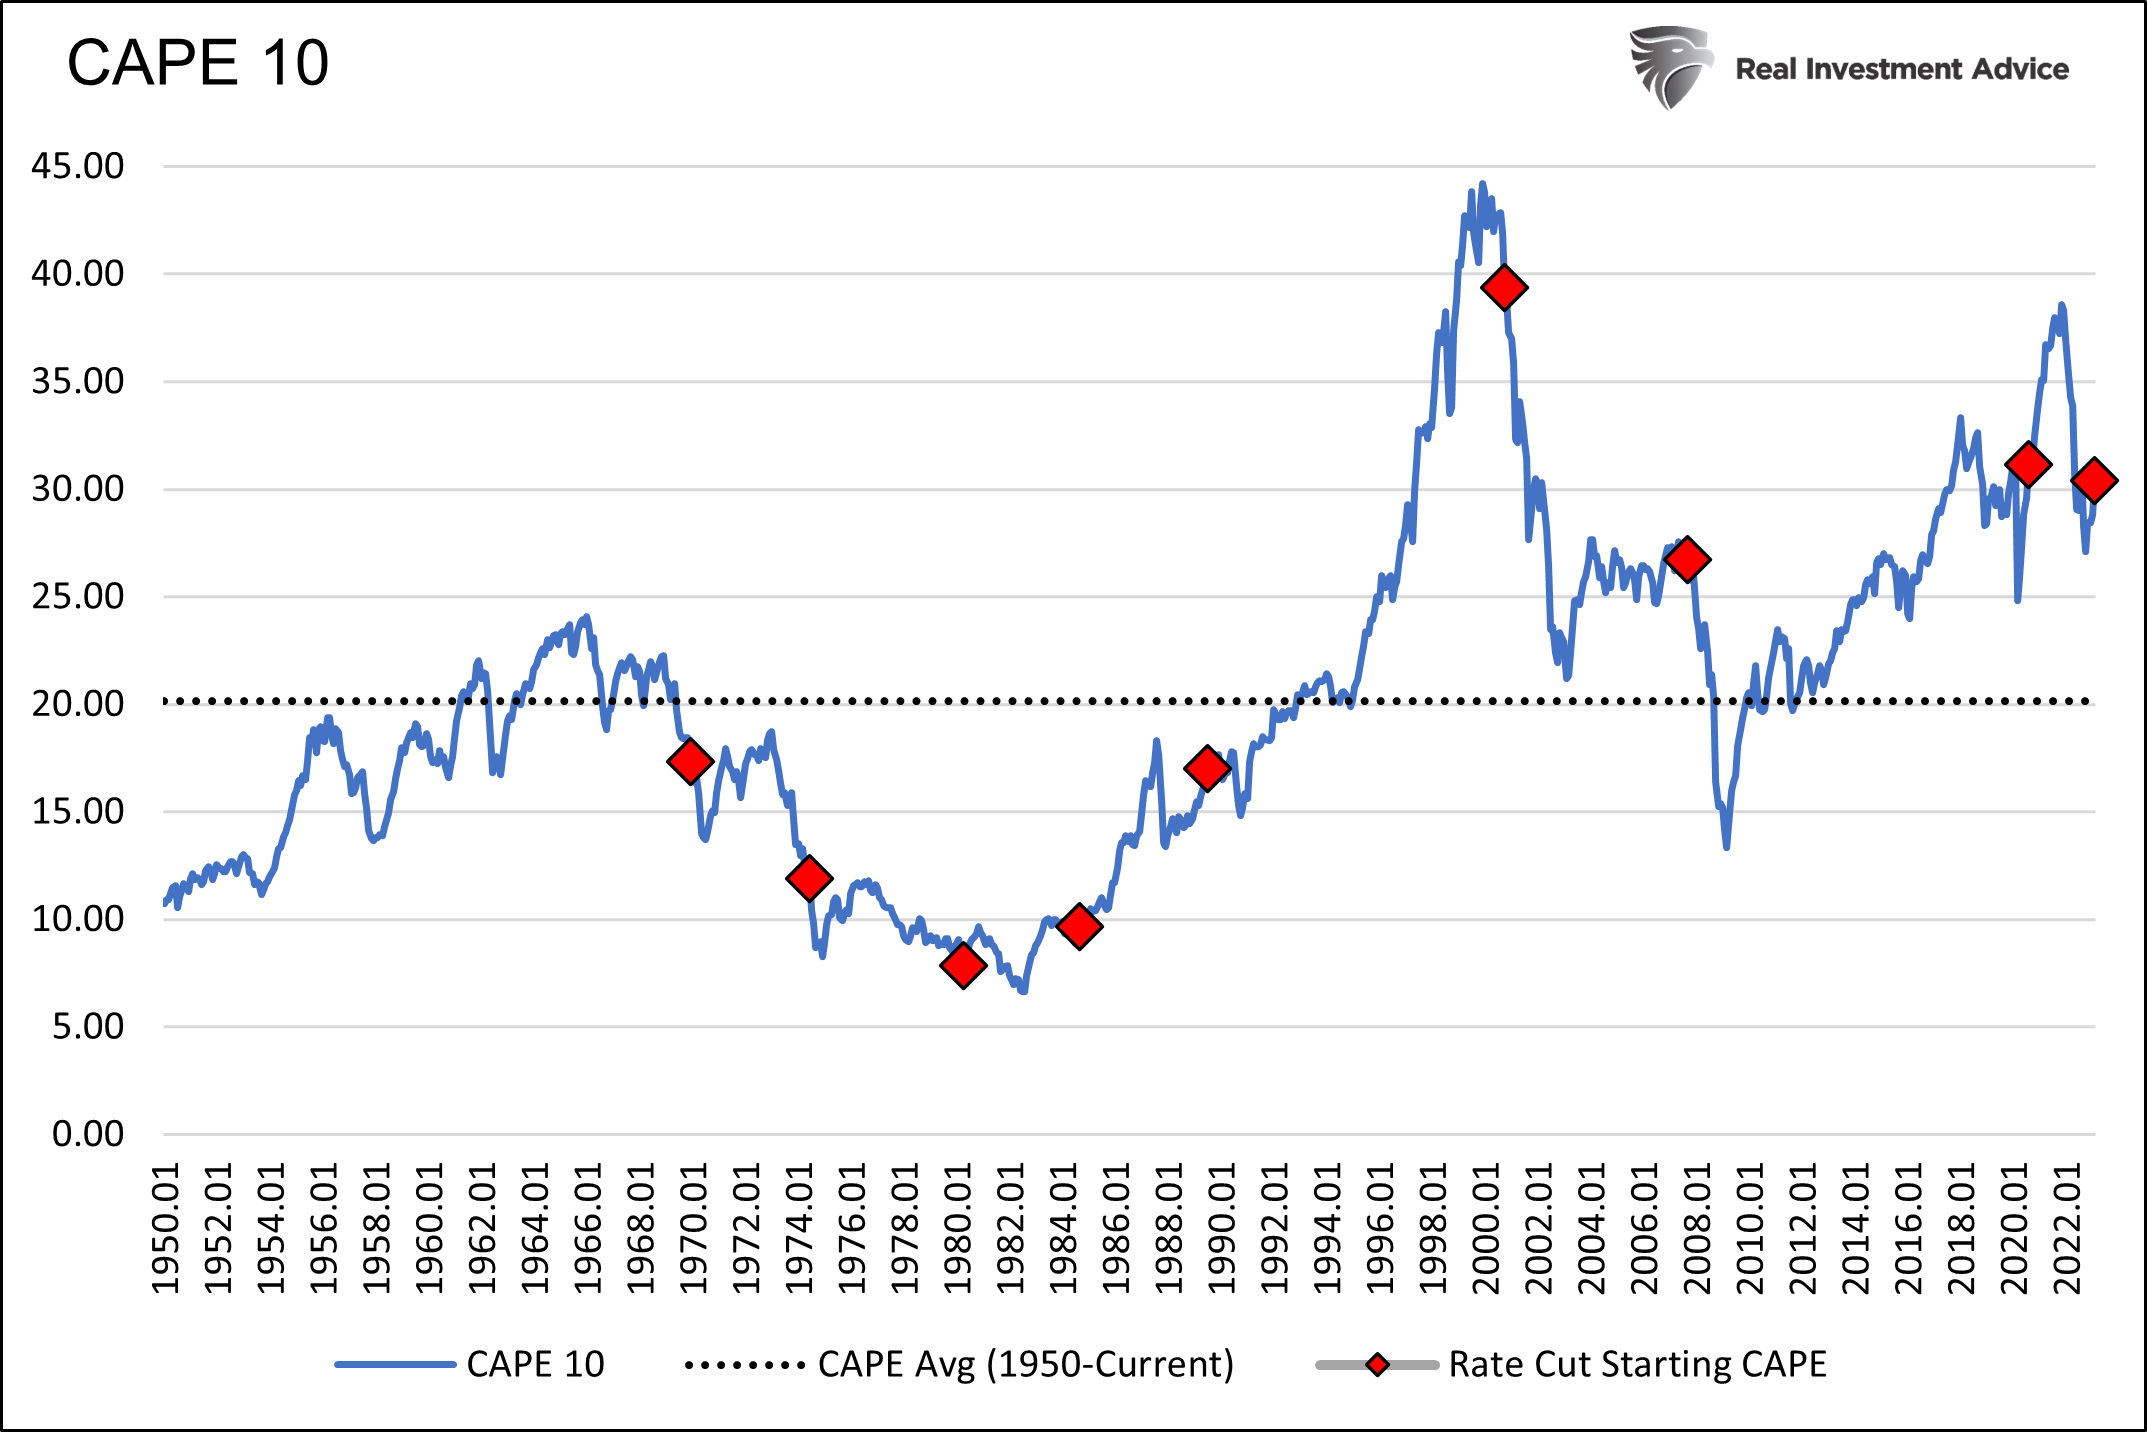
Meanwhile, two years into this bear market, stocks remain priced for a soft landing fantasy where profits continue to rise. The S&P 500’s historically insightful 10-year average price-to-earnings ratio (CAPE), shown below since 1950, remains at a frothy 30, far above past cycle bottoms.