Three-quarters of NASDAQ companies have reported Q1 2023 earnings thus far, and the aggregate year-over-year EPS decline is 10.2%. After rebounding 17% year to date, the NASDAQ remains -23.4% from its peak in November 2021, and the average individual brokerage portfolio is down 27% over the same 17 months.
Canada’s S&P/TSX Composite is expected to report a year-over-year earnings decline of -16.4% in the first quarter with -10.2% and -2.9% for Q2 2023 and Q3 2023, and +7.6% for Q4 2023, making for the full year 2023 earnings of -5.3% (FACTSET data). At the same time, t
S&P 500 earnings have contracted 2.2% in the first quarter, but the consensus expects a rebound in the second half, making 2023 EPS a positive 2%. Led by a record 14% concentration in the two most expensive companies (Apple and Microsoft), the S&P has bounced 7.7% year to date and remains -13% since its December 2021 peak.
Historically reliable leading and coincident economic indicators suggest a recession is unfolding in 2023. The average peak-to-trough S&P 500 earnings decline during past recessions has been 20%+.
The current Shiller 10-year cyclically adjusted Price to Earnings ratio for the S&P 500 is 28.9 x (from 33.89 x one year ago) and compares to a long-term average of 17 and significantly below that average at past bear market bottoms.
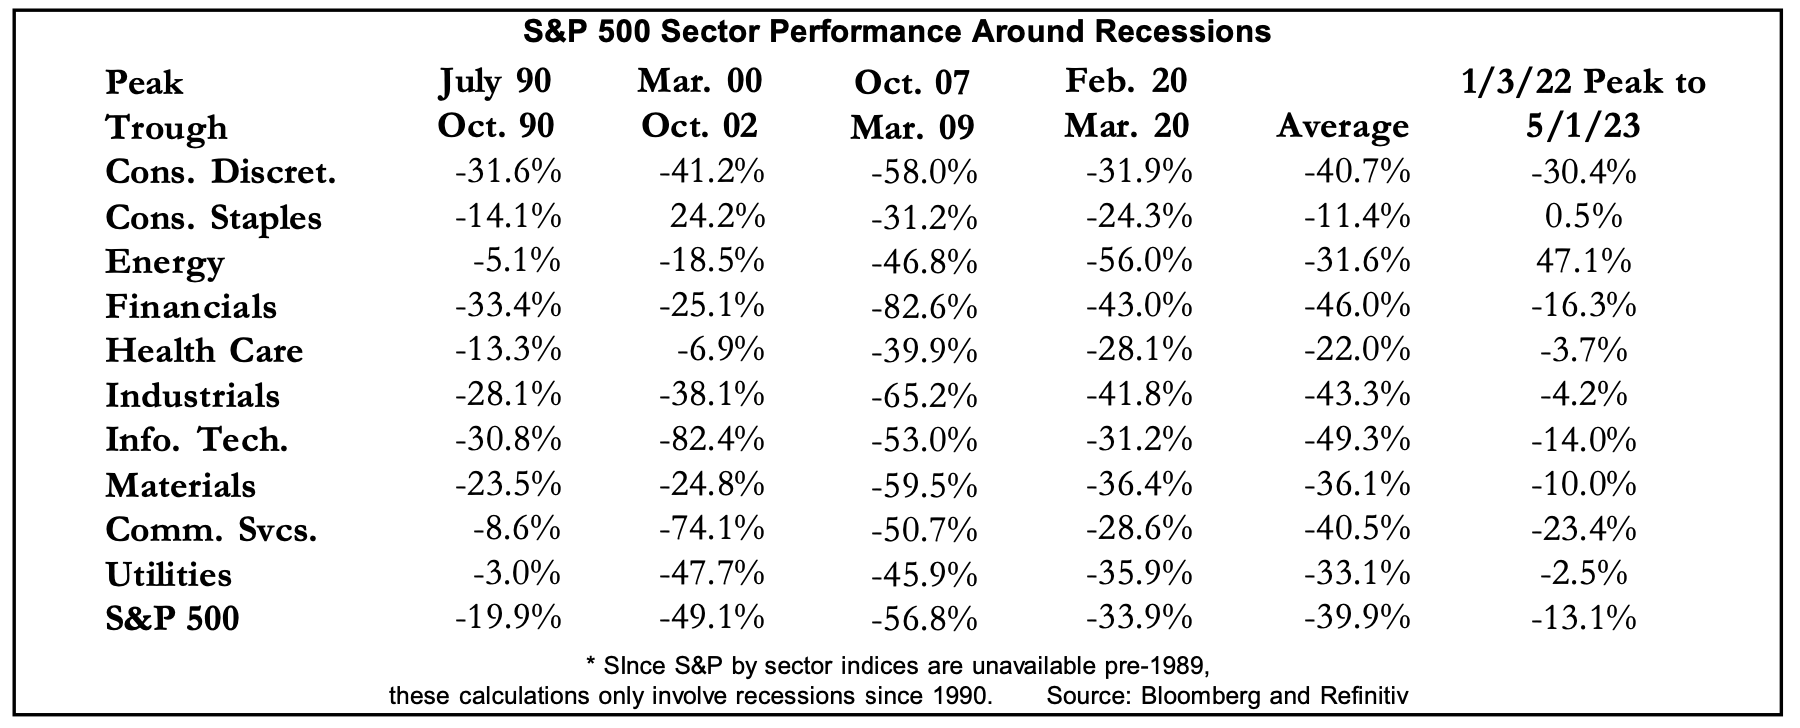
The table below (courtesy of A.Gary Shilling’s May 2023 Insight) shows the actual peak-to-trough price decline for all equity sectors during past recessions (1990, 2000-02, 2007-09 and 2020), as well as the average loss over all four (5th column).
The final column shows the price change over this cycle to date and suggests much downside is yet to come. This all aligns with past recessionary bear markets where the lion’s share of equity losses happened during the months after the Fed paused tightening efforts and returned to easing.
Bear markets have a psychologically challenging ebb and flow that suckers the cyclically uninformed all the way down. It pays to be big-picture aware and disciplined.


