
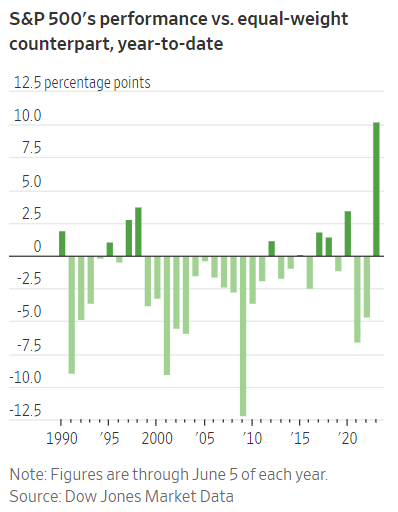
The S&P 500 is up 11% YTD (below in brown); the Nasdaq nearly 33%; and the TSX is +2.5%. Under the hood, a 53% year-to-date average gain for the seven most expensive US tech companies has done the lifting (in green below since December 2022), while the other 493 S&P 500 companies (in orange) have gone nowhere.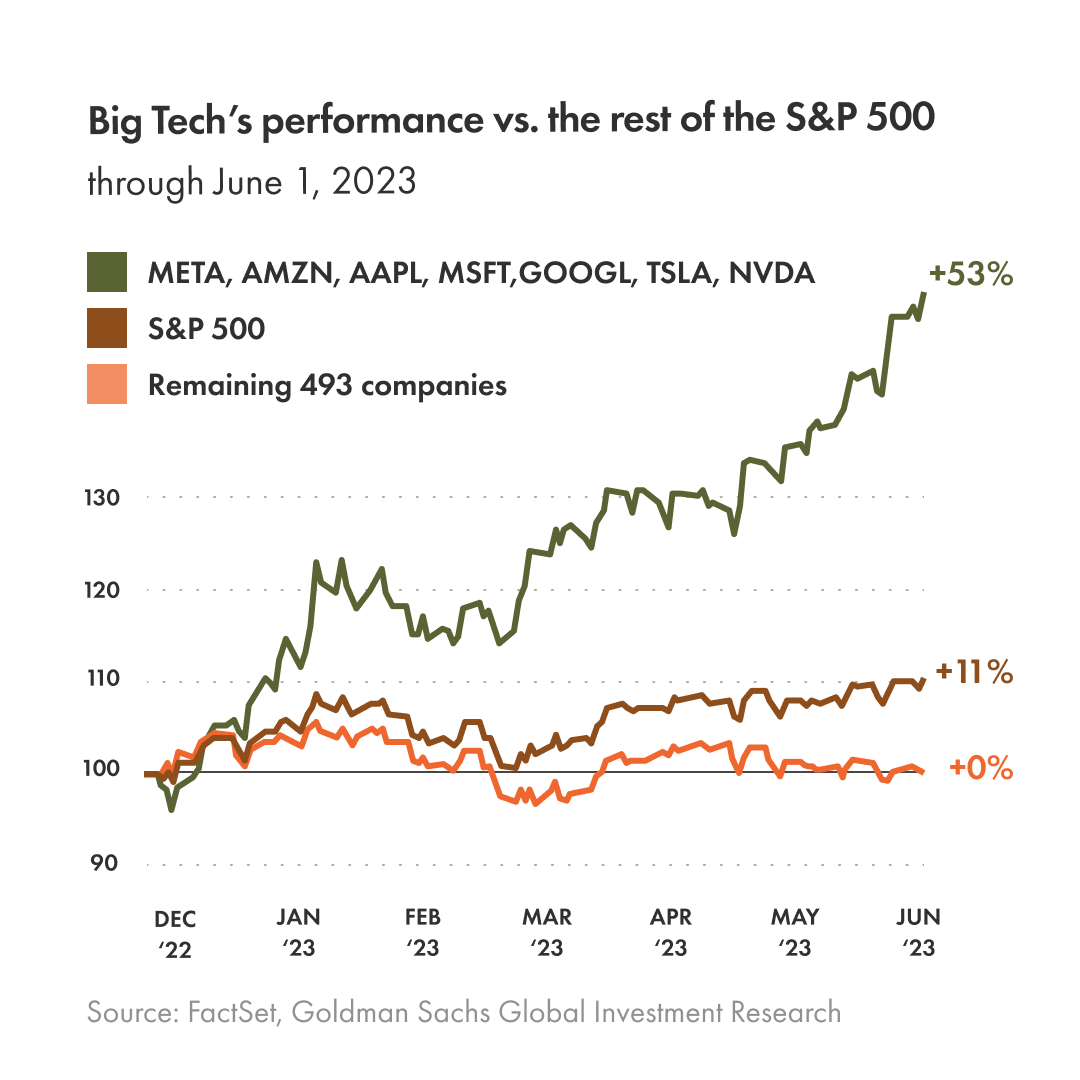 As shown below, the year-to-date market-weighted S&P 500 gain versus an equal-weighted basket is the most extreme since at least 1990.
 Today, the eight most expensive tech stocks account for 30% of the S&P 500 market cap. At the March 2000 cycle peak, tech accounted for 34.8% of the index. Sixteen years and two brutal bear markets later, the sector had shrunk to 20% of the S&P market cap.
As shown below by my partner Cory Venable, the S&P 500’s 51% drop through October 2022 saw a series of sharp rebounds, including one from June to September 2000 that nearly reclaimed the March 200o top.
Sentiment and stock allocations among participants are back near record highs. The S&P 500 has rebounded within 10% of its December 2021 peak, and there’s excited talk that a new bull market has begun. History warns that we’ve not nearly earned that yet.
