This discussion offers insight into the origins of QE and what follows as fund flows reverse (QT).
Richard Werner, Professor of Banking and Economics at the University of Oxford, regarded as the “Father of Quantitative Easing”, discusses the future of monetary policy. Here is a direct video link.
Of course, it is not just quantitative tapering reversing cash out of the global financial system today. Central banks have also tightened overnight interest rates the most abruptly in decades.
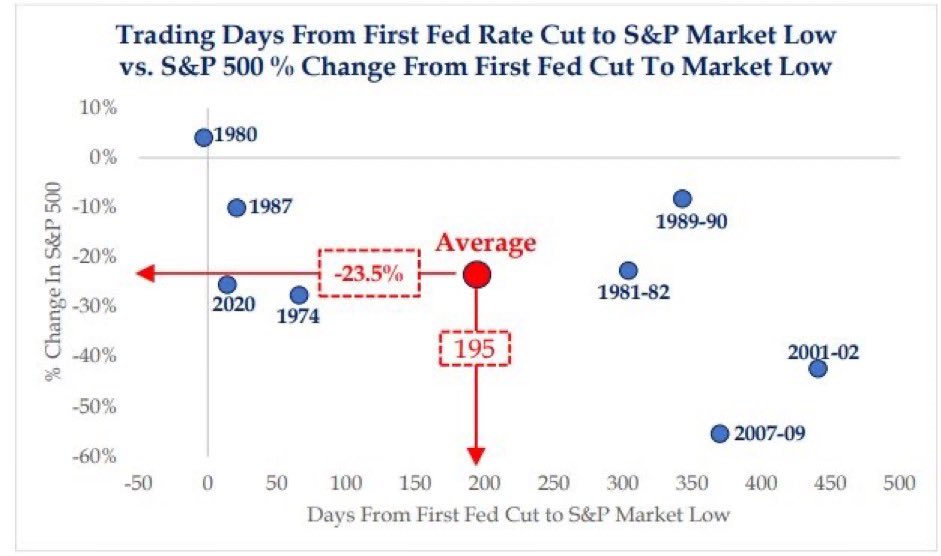
The chart below (courtesy of Barcharts) plots the historical percentage change in the S&P 500 (left axis) from the first Fed rate cut to the market low with the duration in days (bottom axis). Here, we can see that the average stock market decline after the Fed started cutting its policy rate has been 23.5% over 195 days. Moreover, when stock valuations started the cutting cycle near historic highs (like now, 1974, 2001, 2007 and 2020), the stock market declines were in the 30 to 55% range while the Fed was aggressively easing.