Risk complacency is evident in exuberantly priced assets.
Stocks do not provide contractually prescribed interest payments or a return of principal date. Some pay dividends, but these are always at the discretion of corporate management and can and should be cut when a company’s financial circumstances warrant it. When a company becomes insolvent, creditors and bondholders have first dibs on its assets; stockholders are frequently left out of the money.
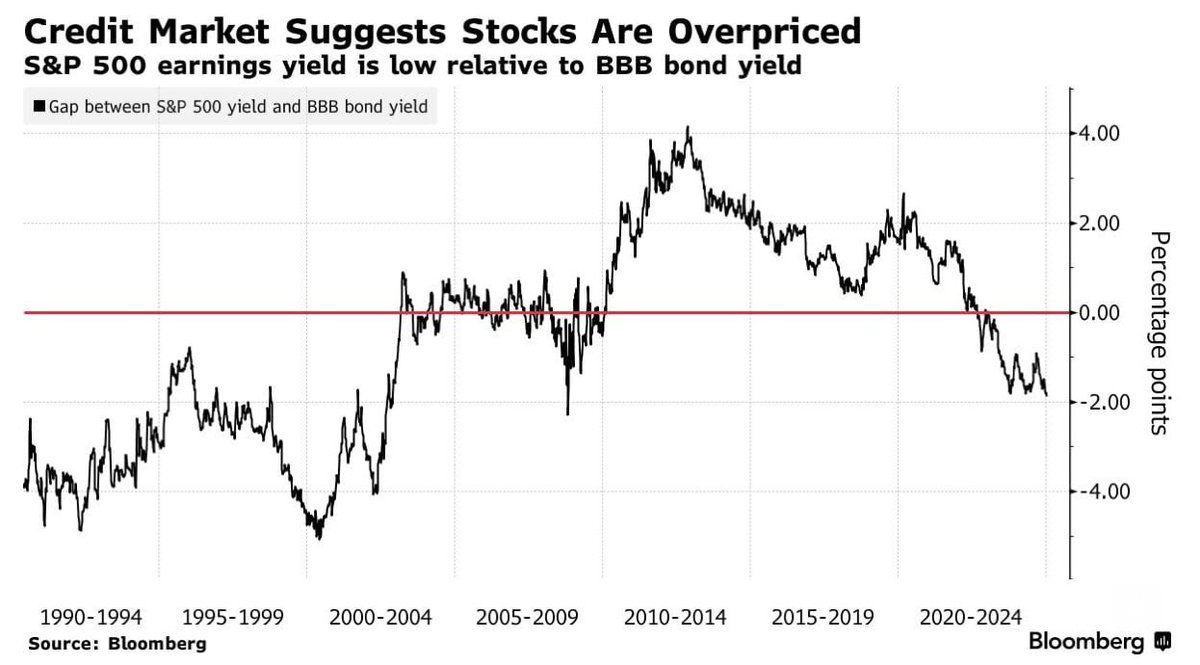
Earnings yield reflects how much profit a company generates per dollar of the stock price paid (the inverse of the price/earnings or P/E multiple) and should be compared to historical averages and the yield available on other assets.
At today’s elevated stock prices, the mean earnings yield for S&P 500 companies is about 3.31%, less than half the historical mean of 7.23%. It’s also 219 bps below the 5.5% average yield presently available on BBB corporate bonds (which have contractually prescribed interest payments and return of principal dates). In this comparison, the large-cap U.S. stocks are as overpriced and unattractive today as in late 2007 and the tech bubble of the late 1990s (shown below). So, stocks are unattractive relative to corporate bonds, but despite what the investment sell side wants us to believe, stocks and corporate bonds are not the only places to put capital.
Government bonds are another contender, and today, the relative yield offered by corporate securities over Treasuries is the least attractive in at least 18 years.
High-yield or ‘junk bonds’ (credit ratings under BBB) offer 279 bps over similar-dated U.S. Treasury bonds today (shown below since 1997)—the smallest yield spread since the now infamously complacent summer of 2007.
By November 2008, as stock and corporate debt prices plunged, junk yields ballooned to 1996 bps over Treasuries. More recently, in the COVID-inspired panic of March 2020, high yield spreads blew out to 877 bps, albeit briefly.
 Even investment-grade corporate bond spreads (Baa and higher) at 144 bps today are the lowest in 27 years (shown below since 1986), and compare with a 393 bp spread in March 2020 and 610 bps in November 2008.
 Companies borrowed record amounts in the past few years (shown below since 1990), and investors are receiving little compensation for elevated capital risk.
  Lest anyone forget, corporate yield spreads are on top of Treasury yields. So, for example, as the 5-year U.S. Treasury yield moved from 37 bps in April 2020 to 438 bps at the end of 2024, investment-grade borrowing costs moved from less than 3% to over 5%, and high-yield borrowers to nearly 12% (U.S. effective yields shown below as of December 31, 2024). They’ve risen further in the last week.
 Most household and commercial loans through the banking system are priced over prime. U.S. prime rates have moved from 3.25% in March 2022 to 7.25% today and, in Canada, from 2.45% to 5.45%.
Despite central bank rate cuts since last summer, higher Treasury yields mean borrowing costs have risen sharply for most borrowers, which is unusual and the opposite of what most have been banking on.
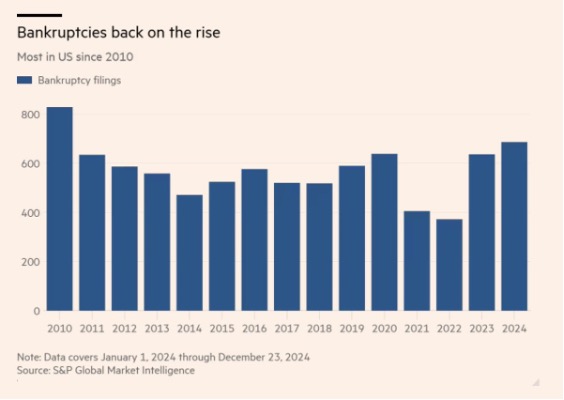
More than 696 US companies filed for bankruptcy in 2024, up 8% over 2023 and higher than any year since 2010 (S&P Global Market data shown below). Restructuring to stave off bankrupty also rose, outnumbering bankruptcies two to one (Fitch). In the process, priority lenders to issuers with at least $100 m in debt have seen the highest capital loss rates since at least 2016. See U.S. Corp. Bankruptcies hit 14-year high as higher rates take a toll.
There are many moving parts in the world today, and many unforeseeable things can happen. However, investment loss cycles are a constant and predictable outcome of not calculating or overestimating future cash flows. Investors can and should resist risk-blind bets. If you want to gamble, buy lottery tickets.


