How long the Trump bump will continue in stock prices is everyone’s guess. Still, great expectations increase room for disappointment, and nothing matters more to long-term investment returns than the level of fundamental valuation at the starting point.
Donald Trump comes back to office astride extreme confidence and the most highly valued stock market of all time, even more inflated than at President Hoover’s inauguration months before the Black Tuesday crash of 1929.
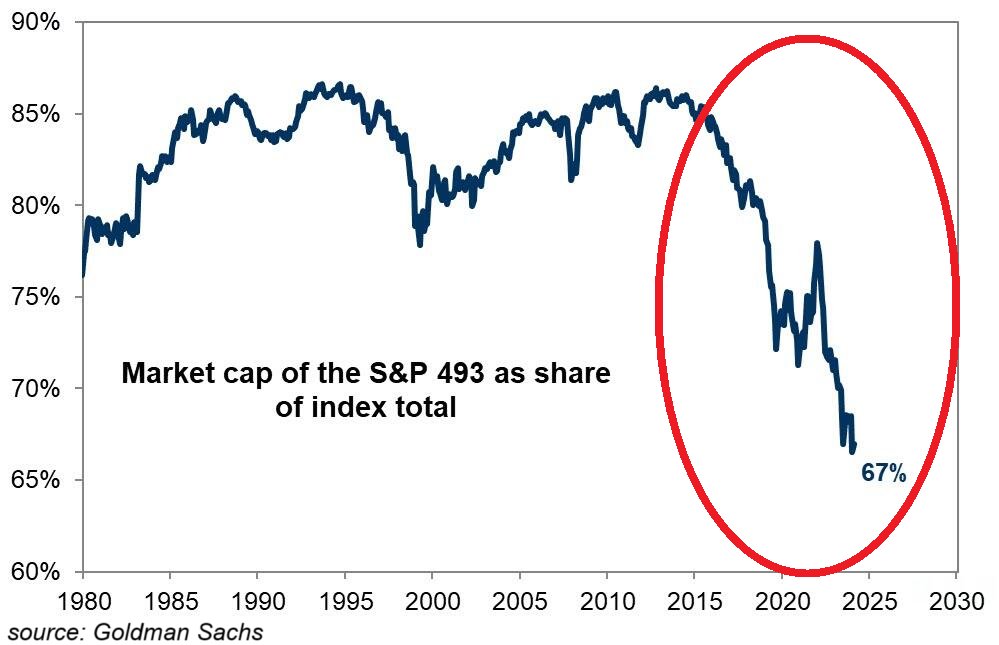
Today, the market capitalization of seven tech companies accounts for a record 32.4% of the widely benchmarked S&P 500 index (leaving the remaining 493 companies to comprise a record low 67% of the index (shown below since 1980 via Goldman Sachs and Global Markets Investor).
 Hyped on A.I. mania, the S&P 500 is trading at 37x (CAPE) earnings expectations, compared with 28x at the start of Hoover and Trump’s first term and 8x when Reagan came to power in 1982. From present CAPE levels, the widely held large capitalization stocks are projected to average -5.2% annually over the next seven years after inflation (GMO data). Meanwhile, downside exposure is endemic with 70% of retirement savings concentrated in equities.
The total market value of U.S. stocks at $61.4 trillion is 209.3% of the last reported GDP ($29 trillion). On this measurement, famous as Warren Buffet’s preferred gauge of prospective equity returns, U.S. stocks are priced for an average annualized return of -0.4% over the next decade, assuming the current dividend yield of 1.16% is reinvested. In March 2000, just before tech stocks crashed by 80% and the broad market halved, U.S. stock prices peaked at 175% of US GDP.
By comparison, Canadian stock markets totalling $4.89 trillion in 2025, trade at 162% of Canadian GDP ($3.019 tn), and compared with 153% at the 2008 cycle peak. If dividends are fully reinvested, Canadian stocks are projected to return 4% annualized over the next decade. Any withdrawals or fees reduce dividend reinvestment and return prospects further.
No wonder, Buffet’s firm Berkshire Hathaway holds a record 30% of its capital ($325 billion) in cash today (shown below since 2004).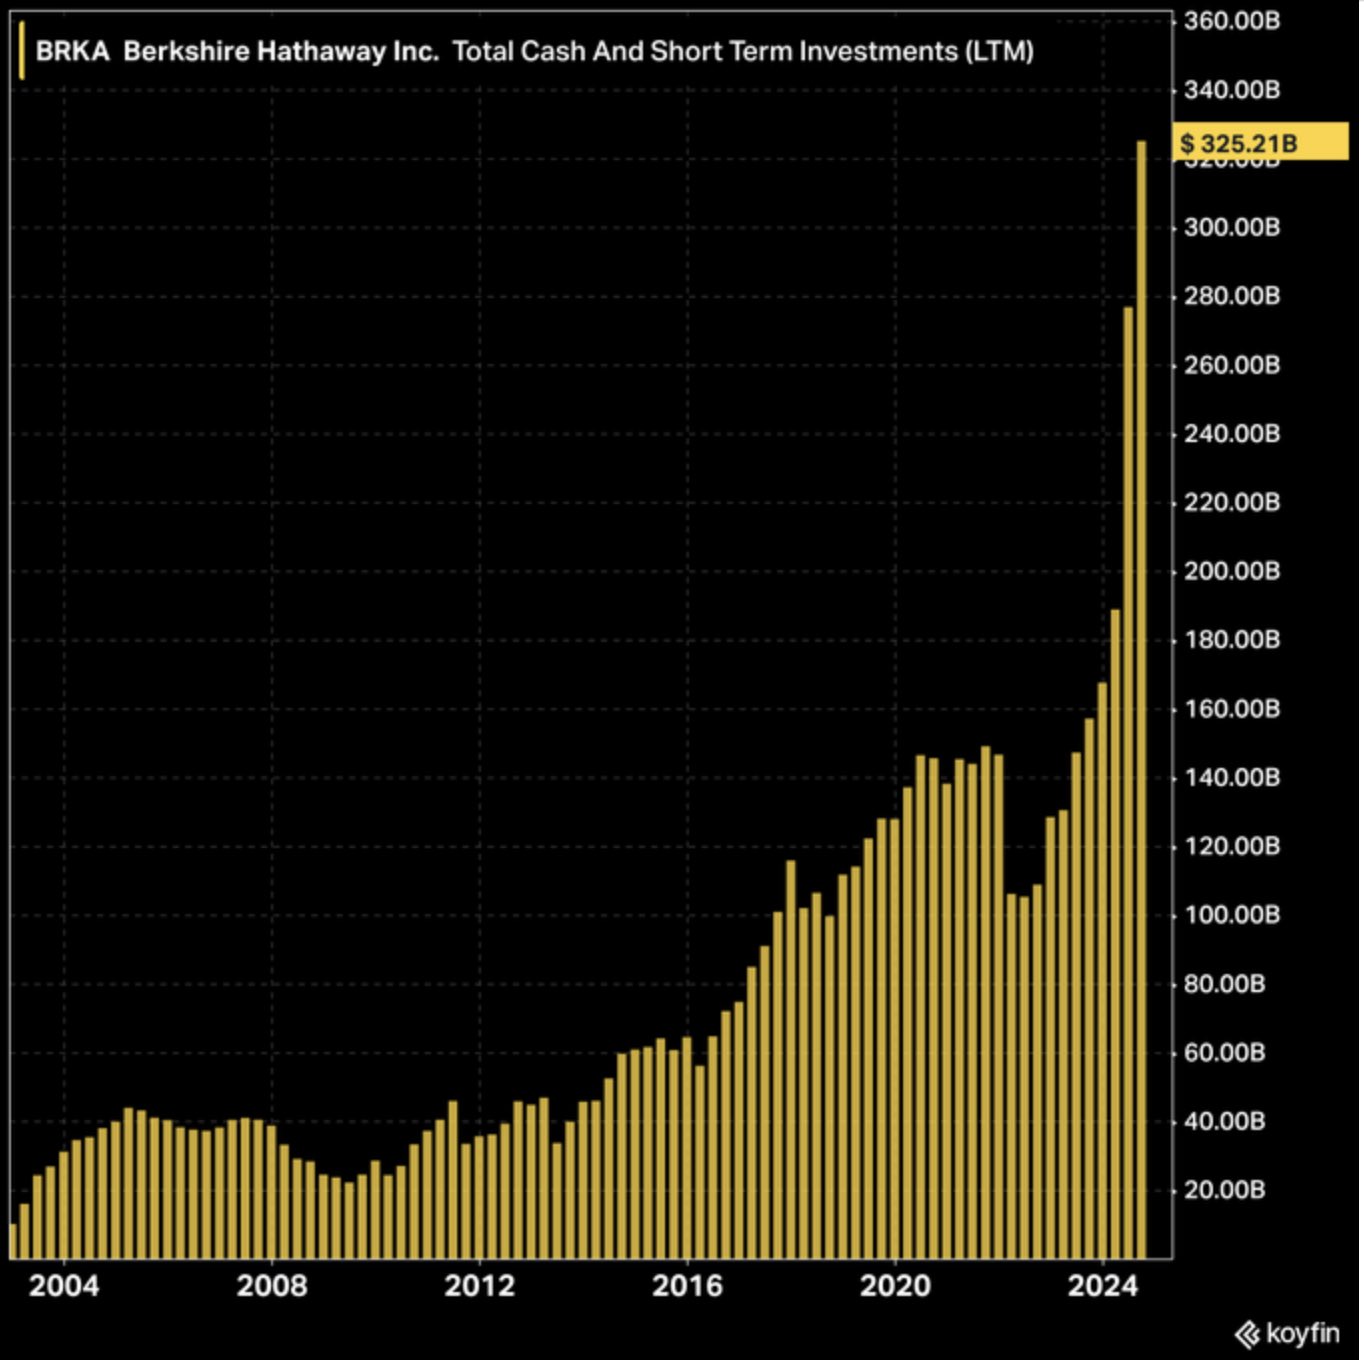
Trump’s proposed tax cuts can also be compared with the Reagan tax cuts of the early 1980s, which started from much higher tax rates (the top marginal rate was 70% in 1981 versus 37% today) and much lower government debt levels (30% of GDP in 1980 vs. 120%+ today), and policy interest rates that were above 18% (vs. 4.25% today). Unlike in 2025, in 1981, policymakers had luxurious space to ease financial conditions and lower tax rates in response to recessions, which they did in various ways for the next 40 years.
Today, demographics are also the inverse of the Reagan presidency, when 85% of the population growth was in the working-age population (25-64). Now, eighty percent of population growth is among seniors (65+), and similar trends are challenging most countries; this is not something governments can fix. Least of all, a government that has vowed to deport undocumented workers and reduce the flow of new immigrants.
The next 90 days promise to be eventful and offer further insight into how many moving parts may unfold. The most rewarding investment opportunities come while the masses are liquidating; that is yet to come.