Equity prices have made some ‘mean reversion’ progress year-to-date.
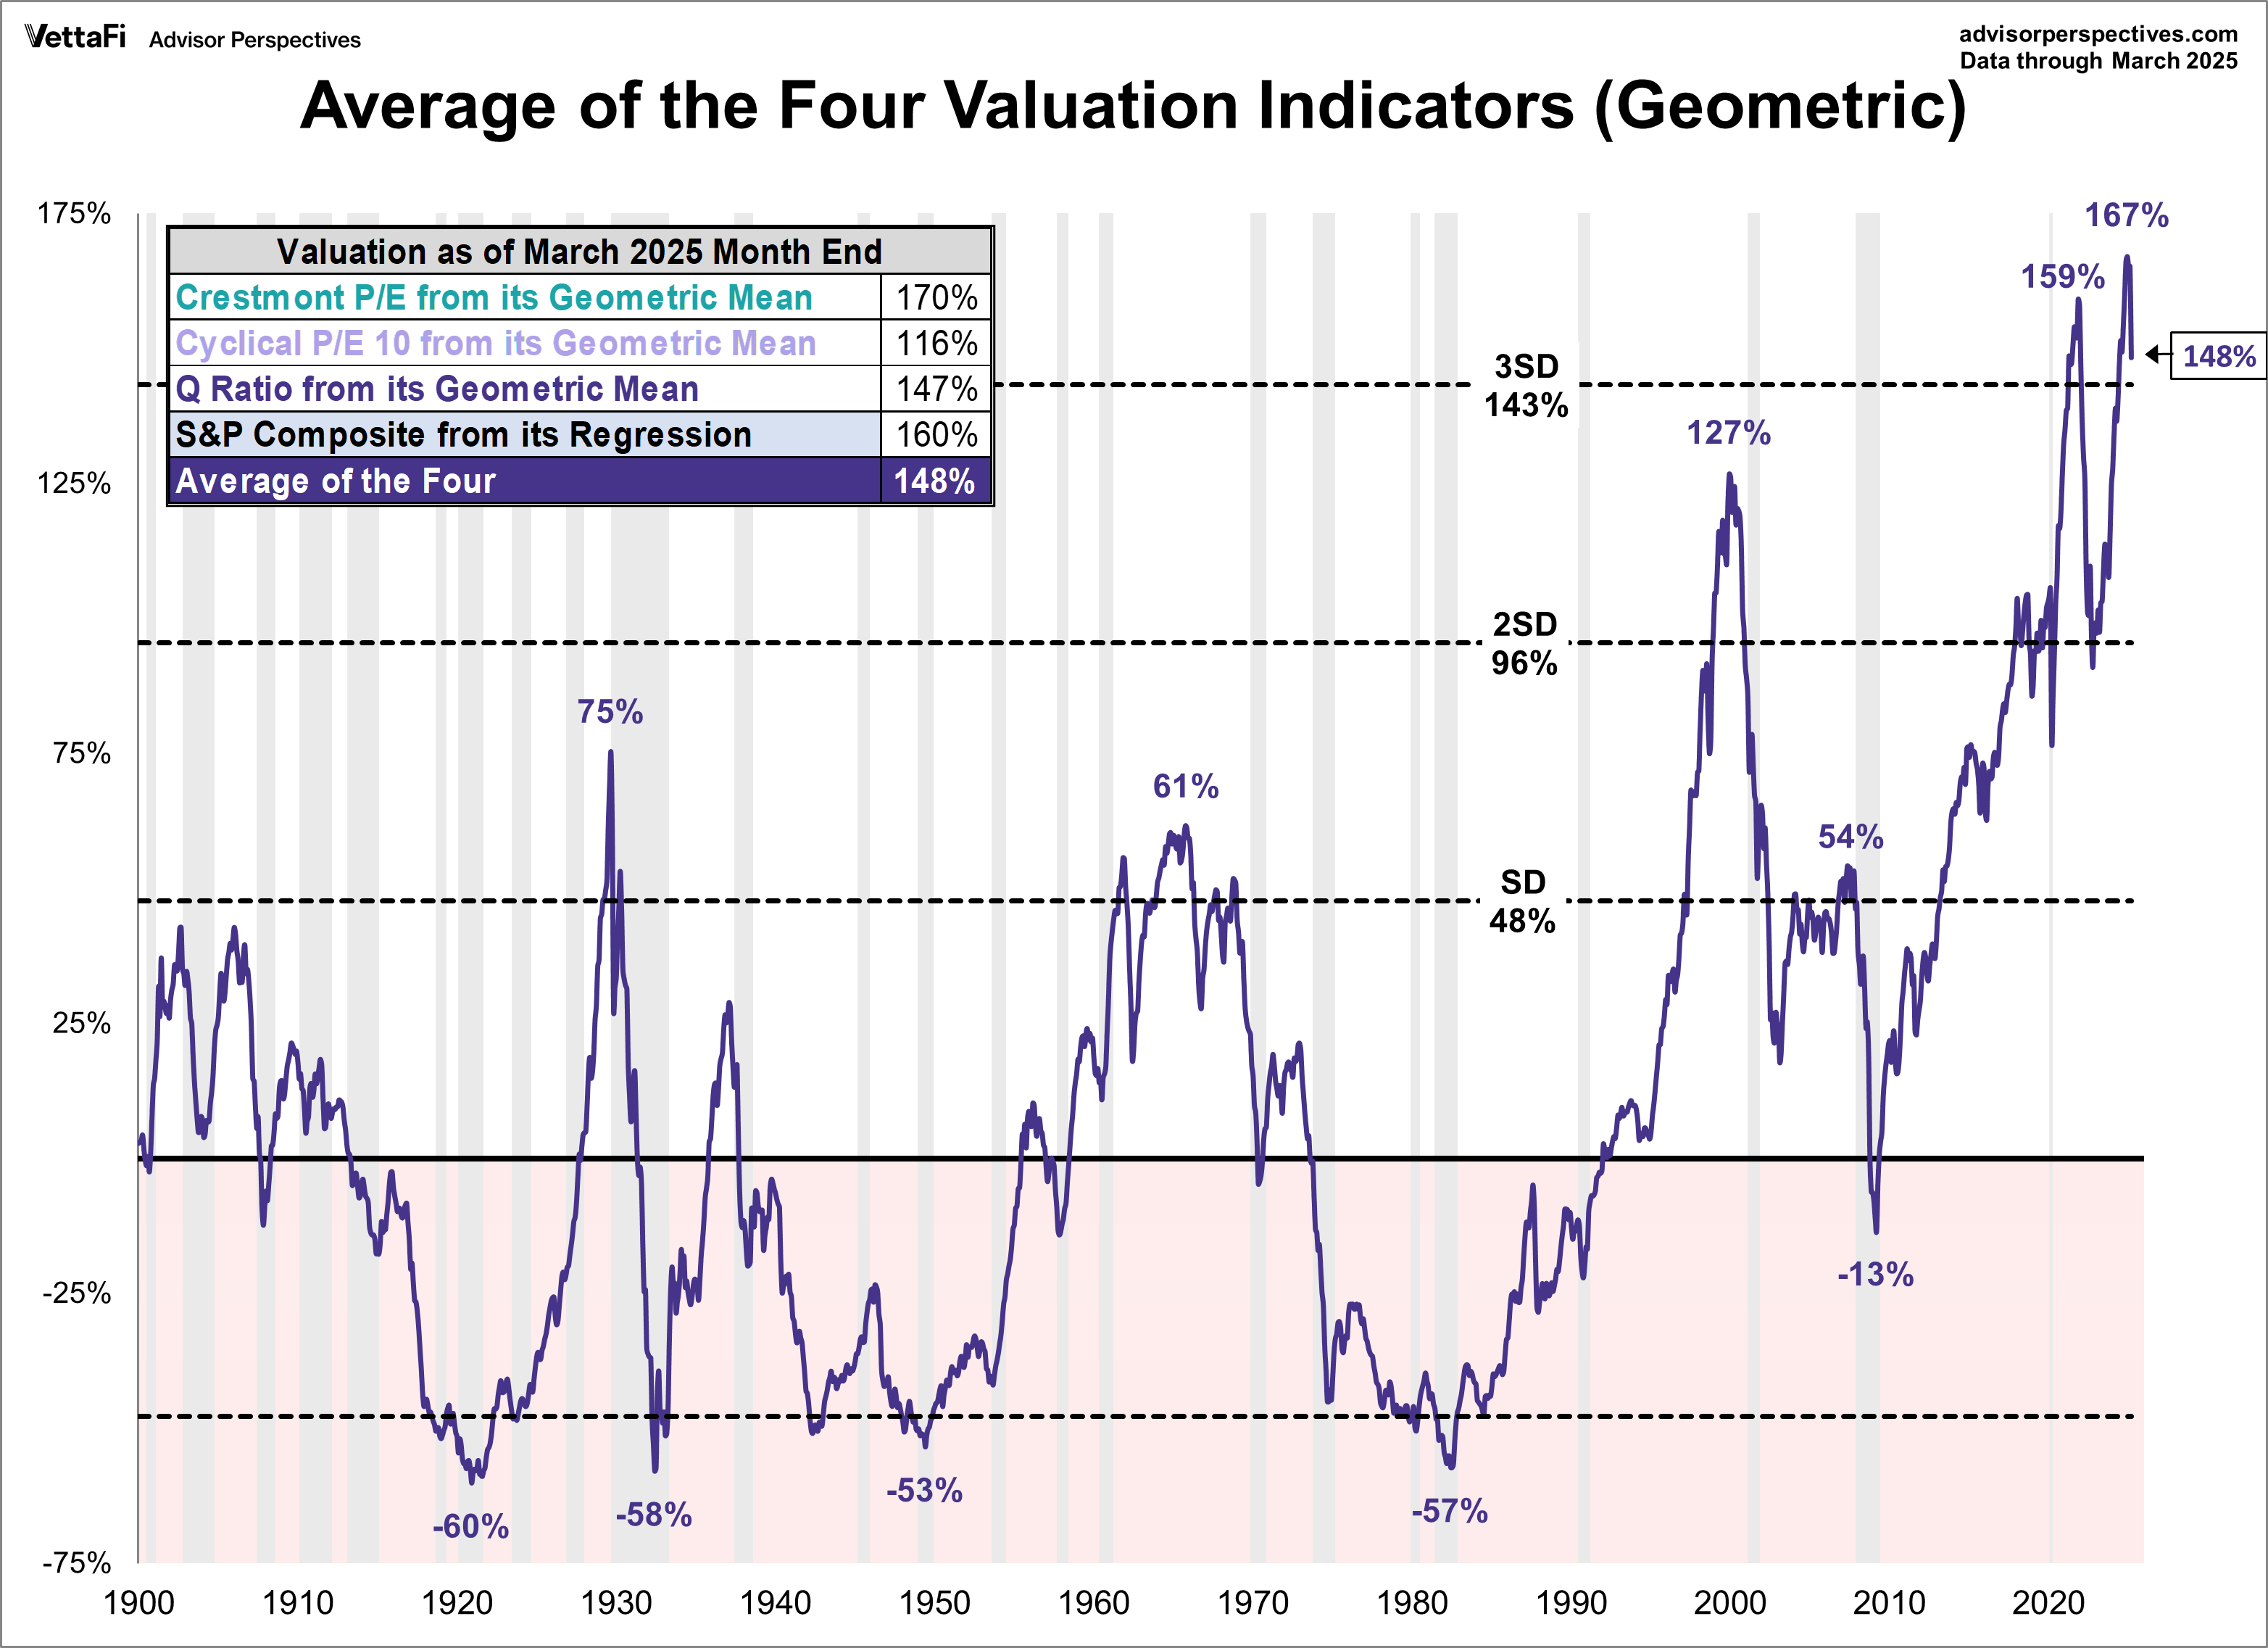
At the end of March, the average geometric valuation for S&P 500 companies had declined to 148% from 167% in February (below since 1900, courtesy of Advisor Perspectives). This was the lowest since June 2024, but still, the most expensive in history and three standard deviations above the long-term historic mean.
 As of the fourth quarter of 2024, U.S. households and nonprofit organizations held approximately 43.5% ($50.96 trillion) of their capital in corporate equities, directly and indirectly, compared with just 15.3% ($18.33 trillion) in cash and deposits, including money market funds.
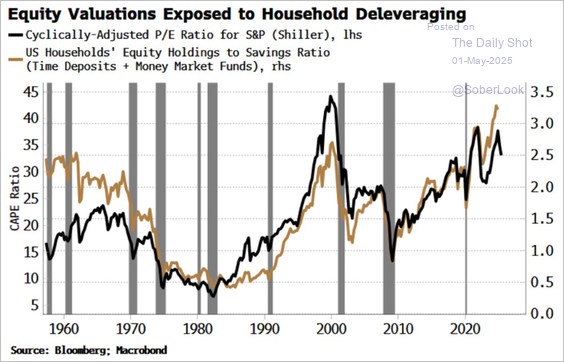
This resulted in a ratio of equity holdings to cash savings of 2.78 times, second only to 3.4x in the 2000 tech bubble and 2.9x in 2021 (black line below, right axis, since 1900). As we saw in past recessions and bear markets (see grey bars below), when individuals want/need to raise cash, high equity-to-cash ratios magnify downside pressure on asset prices, particularly when starting from bubble valuations (like 1960, 2000, 2008, 2021 and now). Prices have taken years to recover from past liquidation events.
 This brings us to serious questions: how much “long run” do we have financially, and how much capital risk are we comfortable holding with our savings? Individuals must answer honestly and with self-awareness, hopefully informed by real-life experience. The segment below is worth a listen.
Retired Treasury bond manager Robert Kessler has always been skeptical of Wall Street’s “stocks for the long term” mantra. He explains why he is completely out of stocks in his personal portfolio—and why you should consider doing the same. Here is a direct video link.