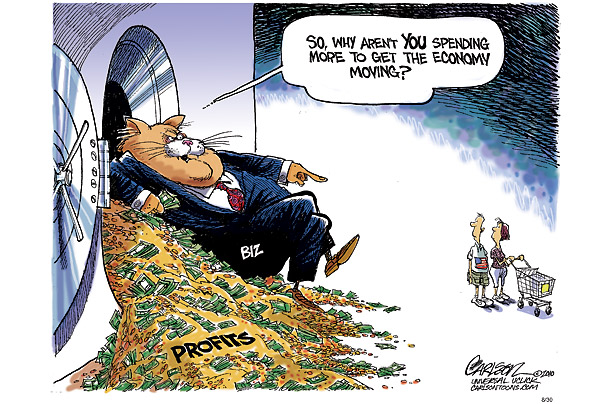
In 2013, $10.832 trillion of the $15.942 trillion GDP produced in the US went toward household purchases. This means that consumer spending from US households–the wealthiest in the world–while diminished since the credit bubble peak in 2007-08, still accounts for more than two-thirds of U.S. economic demand, and remains the most dominant cohort driving global demand. In Q1 the growth in this key sector was lowered to a 1.0 percent rate compared with the long-term average growth trend of more than 3% a year.

While corporations have borrowed trillions at the lowest interest rates in at least 3 centuries and then plowed the funds into buying back their own shares on the open market to increase reported profits (per share) and use their sky-high stocks as the “free” currency for mergers and acquisitions of other over-valued companies, the aging and indebted western consumer continues to slip further below historic consumption trends.
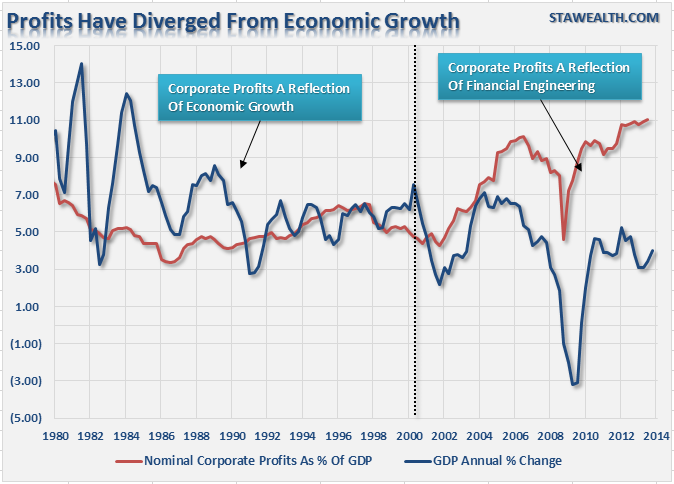
The great equalizer persists however: just as neither labor nor management get their way indefinitely in the interdependent ecosystem of a consumer-led economy, corporate profits remain the most mean-reverting economic series ever plotted as shown below. The glaring overshoot of corporate profits as a percentage of GDP the past 5 years has some re-coupling to do. And when that happens, those owning stocks today valued at 26 times average 10 year earnings, are likely to feel the financial pain of excessive optimism.


