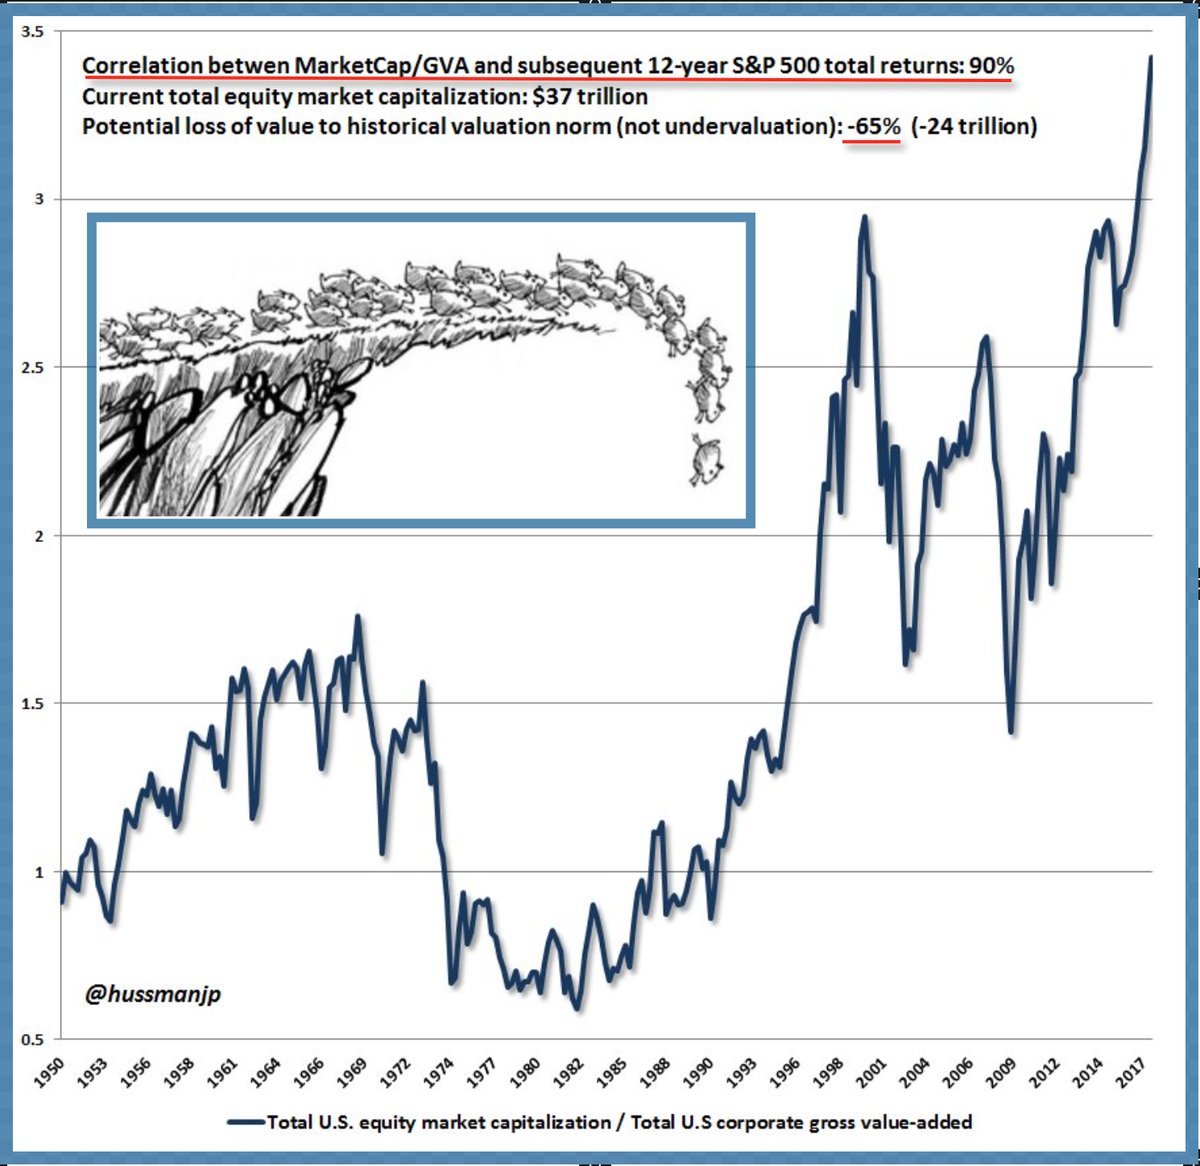
John Hussman’s monthly update is a must read this week. Just the facts folks, just the facts…See Navigating the speculative ID of Wall Street:
The chart below presents an additional set of valuation measures that we find best correlated with actual subsequent 10-12 year S&P 500 total returns in market cycles across history, with significantly greater reliability than alternatives such as forward operating P/E ratios or the Fed Model. These measures are presented as percentage deviations from their respective norms. Presently, these measures are a median of 180% above (2.8 times) those norms. Put another way, simply touching those norms, without any move to historical undervaluation, would presently require a -64% market loss over the completion of the current cycle.


