Wishful thinkers maintain that this cycle is different. Fundamental investment measurements (Price to Earnings, Price to Sales, Price to Book, etc.) are old-school irrelevant in a brave new world of technological disruptors and fee-free momentum traders. But those of us who have lived through a few cycles and retain financial history can’t help but note that we’ve heard this all before.
In the 2002-08 cycle, the narrative was all about an insatiable demand for commodities that would keep ‘hard asset’ prices, realty and corporate securities leaping indefinitely. In the 1993-2000 cycle before that, it was all about the game-changing internet, technology companies and a brilliant central bank head that would keep the economy and corporate security prices leaping well past traditional measurements evermore.
Fast forward to 2o21, and the narrative is again all about game-changing technology, escalating earnings forecasts and all-powerful central banks which ‘won’t let prices go down.’ If only these could ensure investment returns!
As I have discussed frequently, the time-tested reality is that even great companies and properties can be terrible investments depending on the timing and price paid. GMO analysts explained this further yesterday in There are no bad assets…only bad prices.
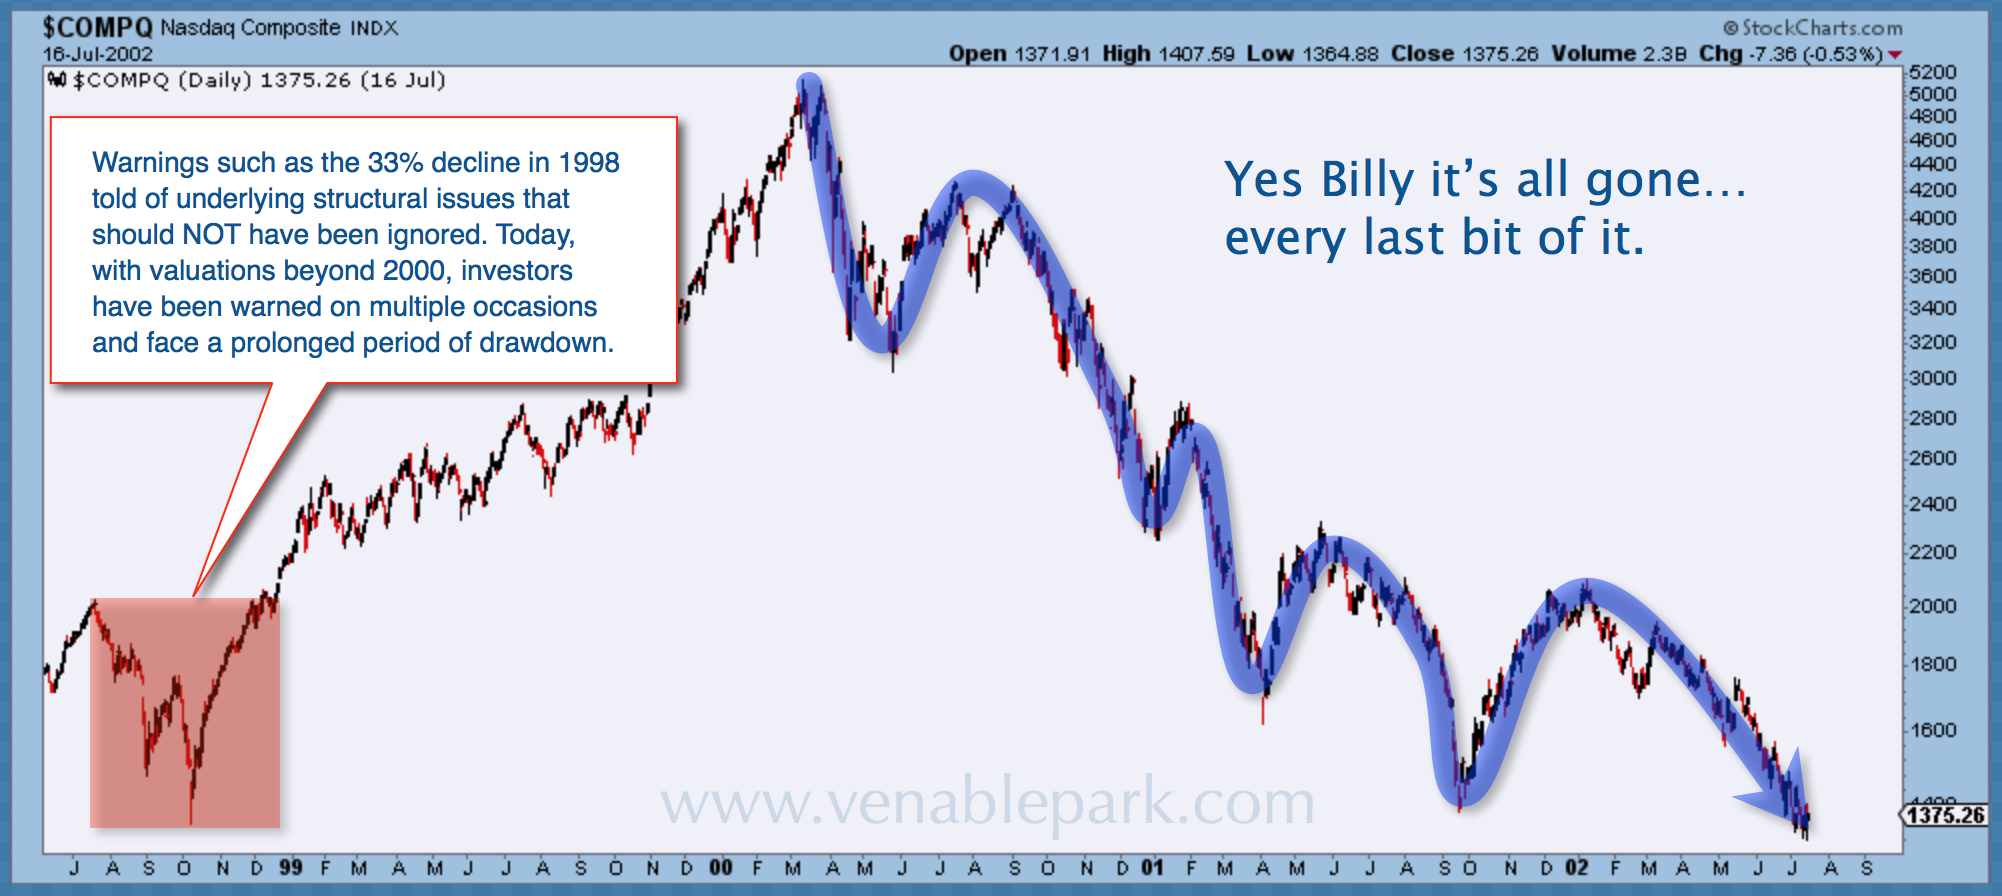
In the chart below, GMO shows (lower left in green) the earnings per share (EPS) forecasts compared with the S&P 500 price index (in red) over the 7 years between March 1993 to 2000. While EPS forecasts rose at a healthy clip, stock prices leapt 69% faster (before collapsing 50 to 80% between 2000 and 2002). On the lower right, they show a similar pattern over the last 7 years, where stock prices have grown 70% faster than already jubilant EPS forecasts.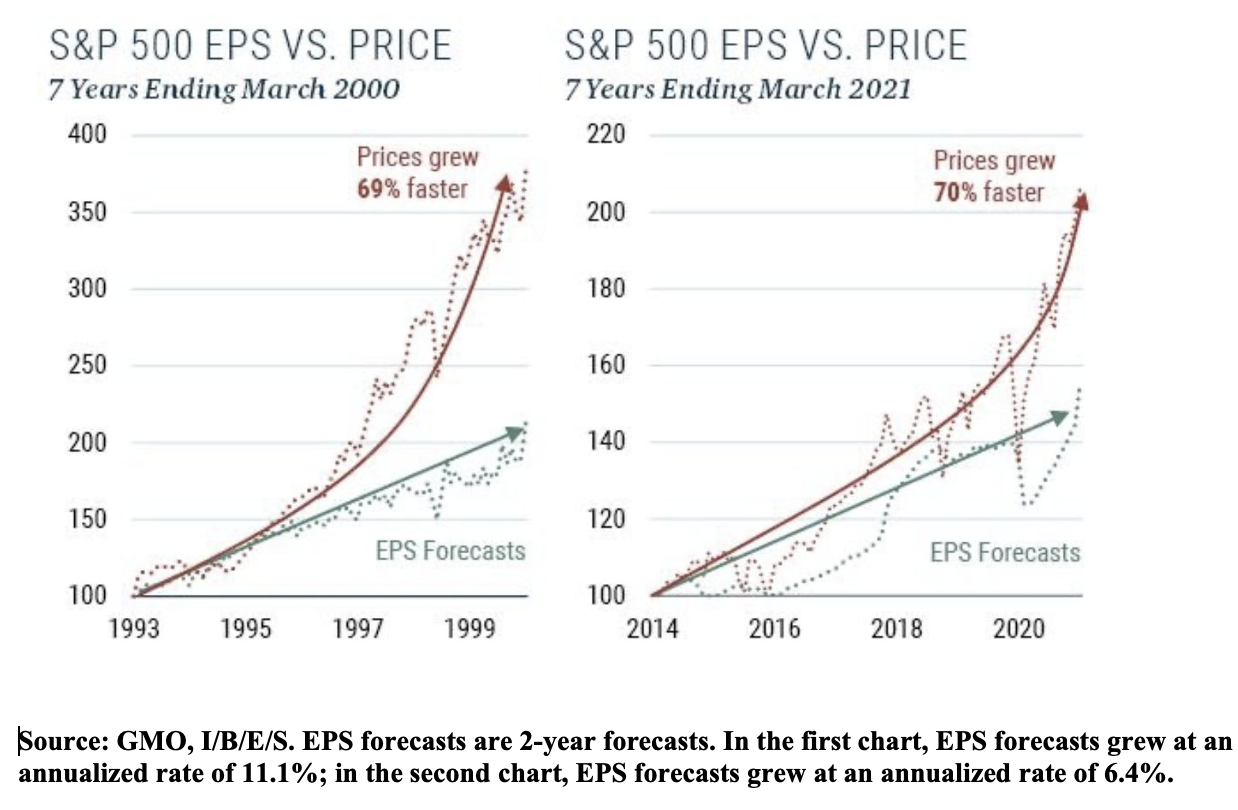 In our May client letter, we noted that today’s pricing disconnect reminded us of the 2000 cycle very much. Because we were there!! We lived it, and no one within 20 years of their retirement today can afford to forget how these pricing overshoots end. My partner Cory’s NASDAQ chart below from June 1998 through August 2002 offers a full cycle study.