
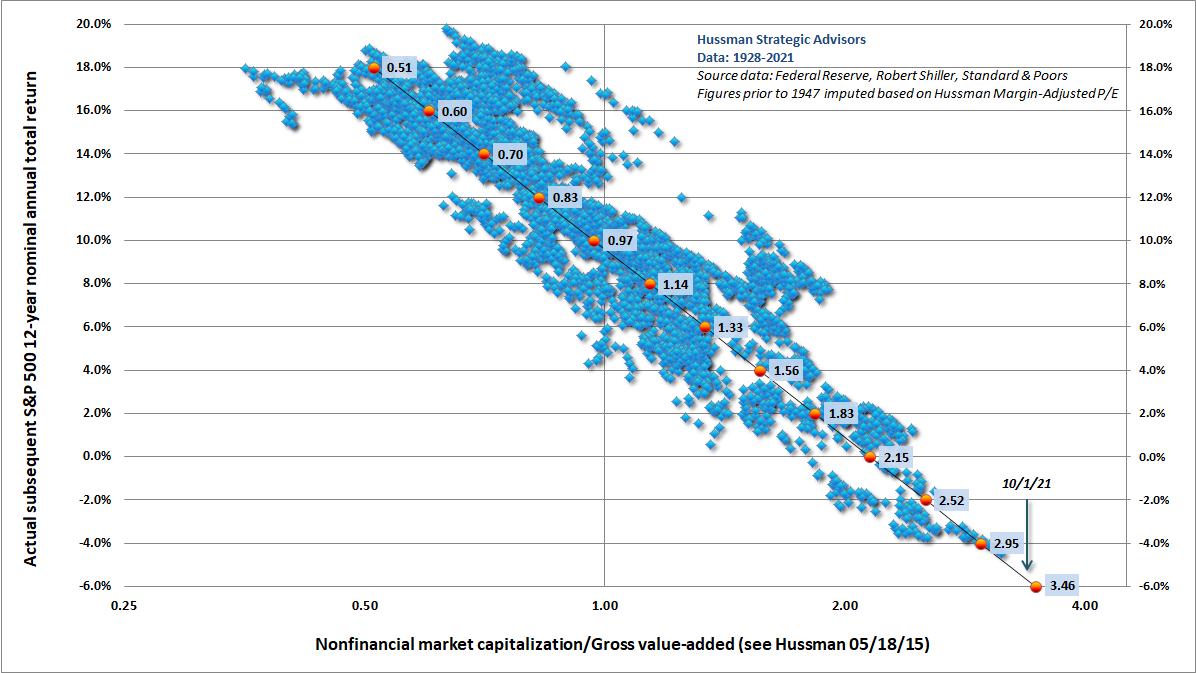
John Hussman’s October letter includes the chart below, which graphs the actual 12-year nominal annual return for stocks from the rare historic incidents when valuations were as high as presently. Here’s the bottom line:
At valuations that presently stand at 3.4 times historical norms, the arithmetic here is daunting. Assuming the same 4% growth rate in S&P 500 revenues and nominal GDP that we’ve observed in the past two decades, a return to run-of-the-mill valuation norms would leave the S&P 500 index unchanged even [ln(3.4)/ln(1.04)=] 31 years from now, although the modest dividend yield of the S&P 500 would add something in the area of 2% annually. At a nominal growth rate of 10% annually, a return to historical valuation norms would still leave the S&P 500 index unchanged nearly 13 years from today.
Note: this would be before any investment fees.
Believe it or not, this is the math:
So 10, 20, or possibly even 30 years from today, investors may look back on years of low or negative total returns and say, well, nobody could have predicted X about the economy, or inflation, or debt, or whatever. What I’m trying to tell you is that it doesn’t matter. The moment you look at where starting valuations are, you already know that, in all probability, the prospects for acceptable stock market returns are screwed. You just don’t quite know what type of screw.

