Notwithstanding yesterday’s bear market bounce, the tech-heavy Nasdaq 3000 index opens today-18% from its November 18 peak–a market cap loss of over $5 trillion in the past four months.
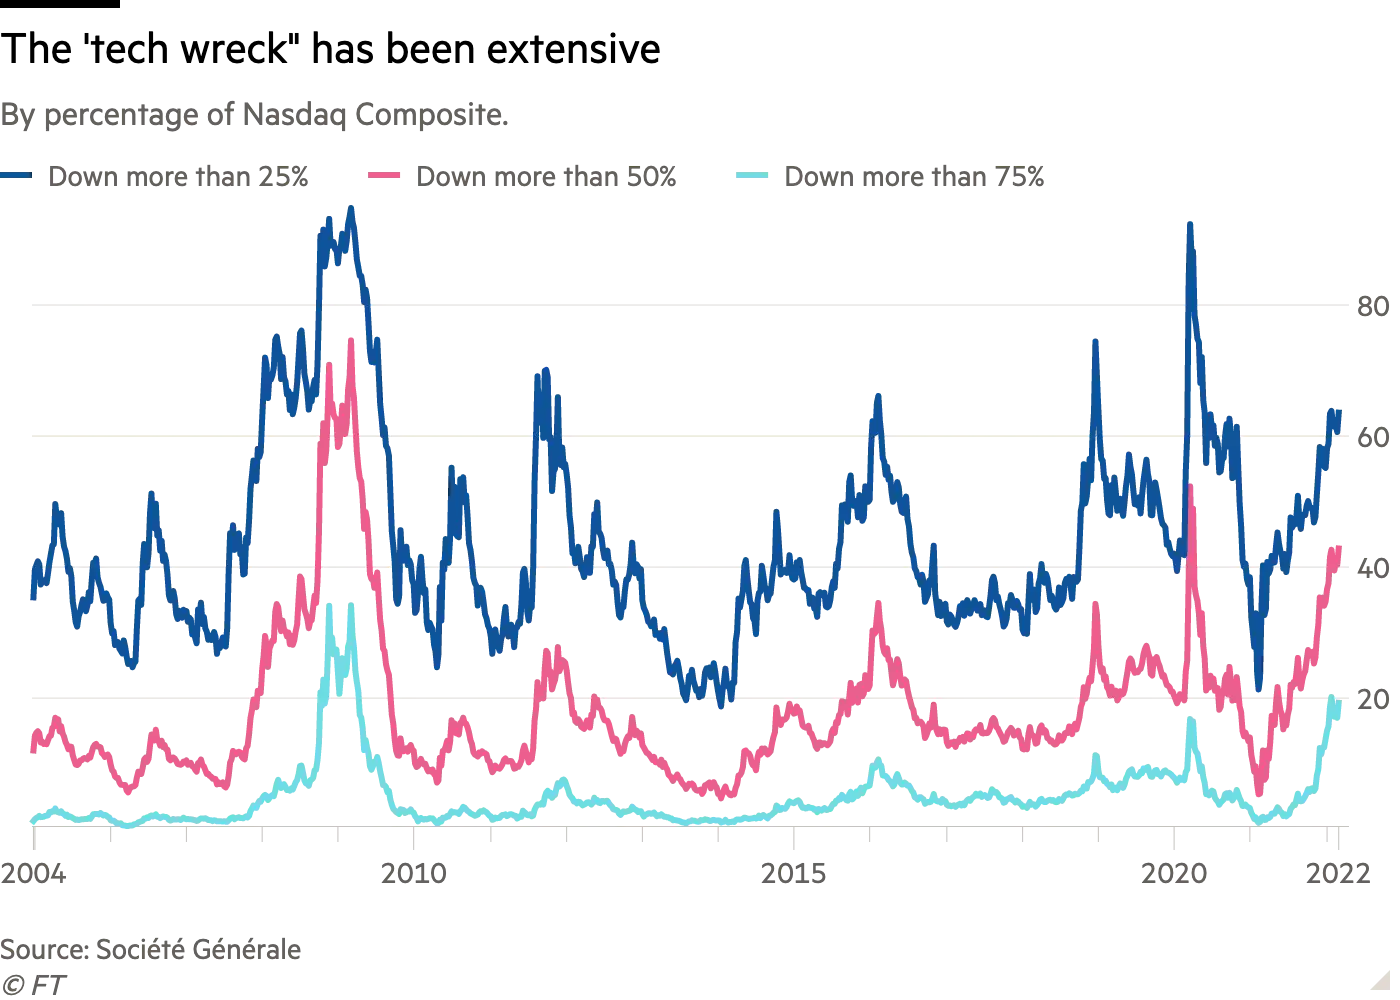
Under the averages, the individual carnage is broad and more significant. As highlighted by Robin Wigglesworth for the Financial Times yesterday (see Tech wreck looks more like another dotcom bubble bursting), nearly two-thirds of the Nasdaq’s 3,000 plus members have fallen at least 25%, 43% by more than half, and almost a fifth over 75%– the most since the 2008 financial crisis. Here’s the visual.
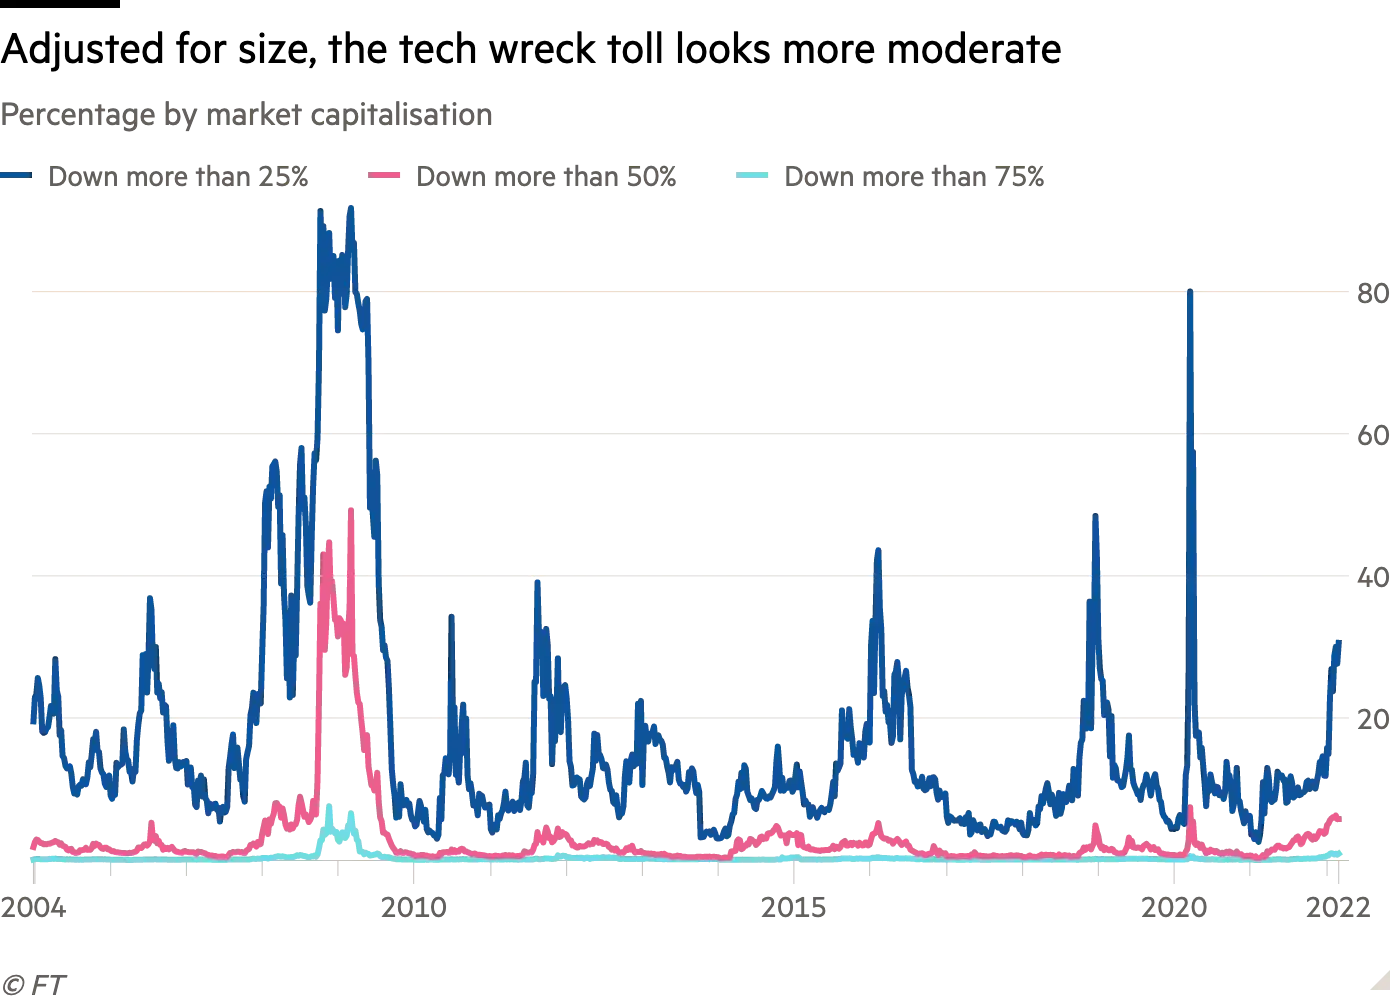
 So far, the two most expensive Nasdaq companies by market cap, Apple (making up 12% of the top 100) and Microsoft (10%), have softened the index losses with relatively mild declines to date (-13% and -17% as of last night’s close). Adjusted for market cap, about 30% of the Nasdaq is down more than 25% so far, much less than the 80% plus who took that beating in the 2008 bear market (see below). But then, this bear market is only just started.
 Since 2019, we noted that stock indices were extra vulnerable because their gains were being driven by a handful of widely adored and over-bought leaders. The top five most expensive companies in the S&P 500 (Apple, Microsoft, Amazon, Alphabet and Facebook) accounted for a whopping 23% of the index in 2021, compared with a peak concentration of 18% (for Microsoft, GE, Cisco, Intel and Wallmart) at the 2000 market top. After weaker companies have been taken out on stretchers, bears come for the most expensive, widely held ones. Then the selling intensifies.
Repricing of Amazon (-26% as of last night’s close), Alphabet (-11%) and Meta (Facebook -50%) is well underway. At 12% of the Nasdaq 100 and 7% of the S&P 500 market caps, the bullish dreams of index-tracking funds and portfolios are now dependent on Apple more than ever.
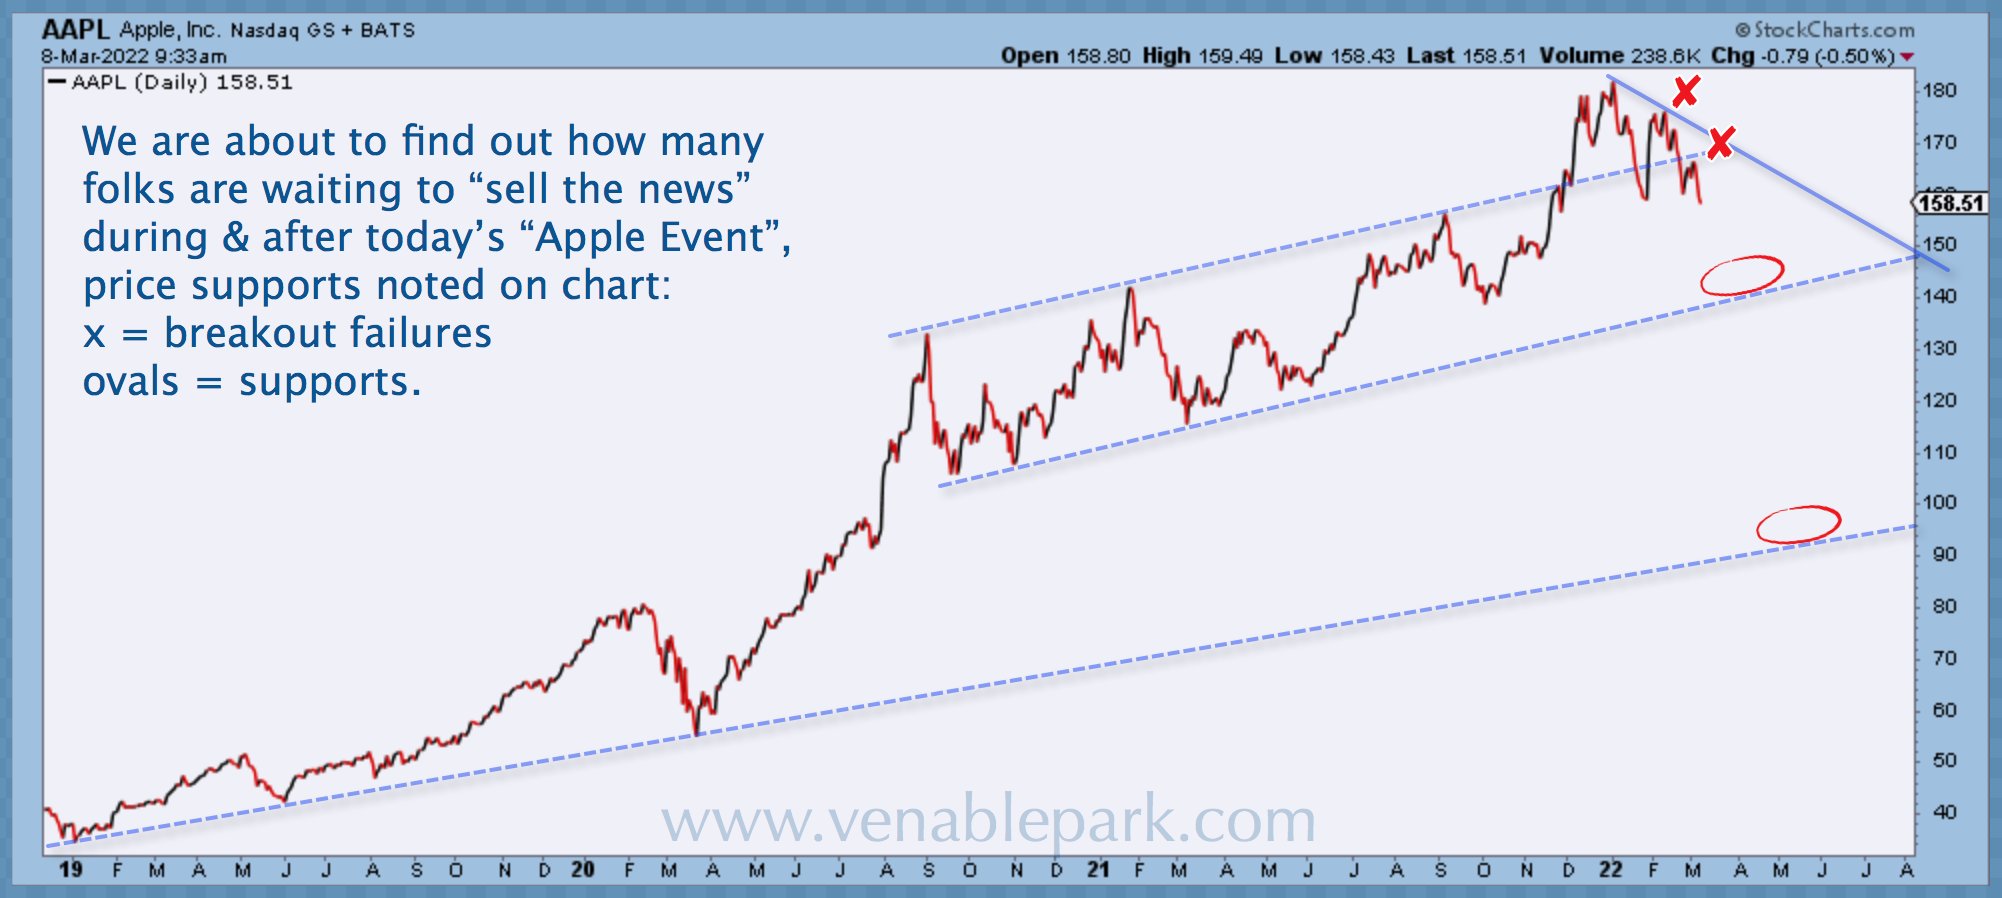
As shown below from my partner Cory Venable since 2019, from $158 today (-13% from its $182 high), the next downside tests for Apple are at the $150 and $95 areas (-47% where it topped in January). As extreme leverage and concentration unwind, a 47% decline would be milder than historically typical. A peak to trough loss greater than 60% would be more normal and stock indices will tumble for the ride. Early dip buyers should be aware.


