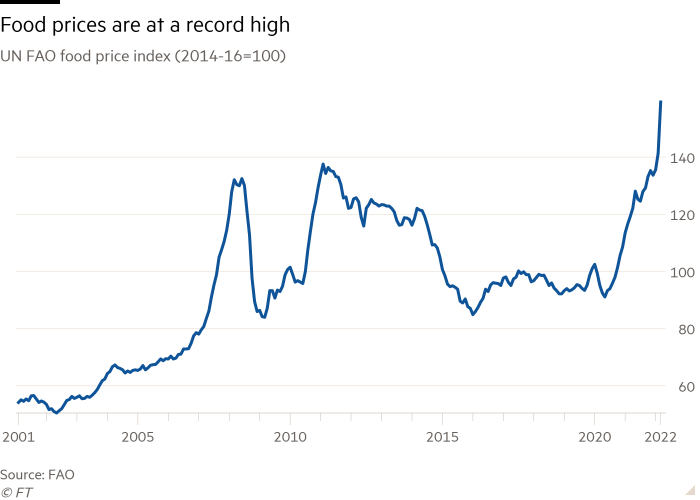
Gasoline prices leapt 45% over the past year, and the UN Food and Agriculture food price index, rose 34 percent to an all-time high in March (shown below since 2001).
In the process, expectations for central bank rate hikes have triggered an abrupt sell-off in financial markets.
As shown below, courtesy of Bloomberg and Lance Roberts, US aggregate bond prices have had their longest and third-largest monthly drawdown since 1979. Similar bond moves have spiked borrowing costs globally.
As noted in the far ri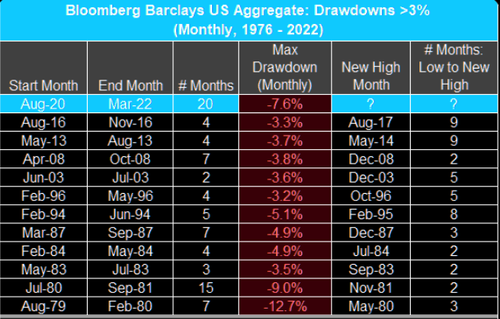 ght column, other and lesser drawdown periods (yield spikes) were buying opportunities that saw bond prices rebound to new highs two to nine months later.
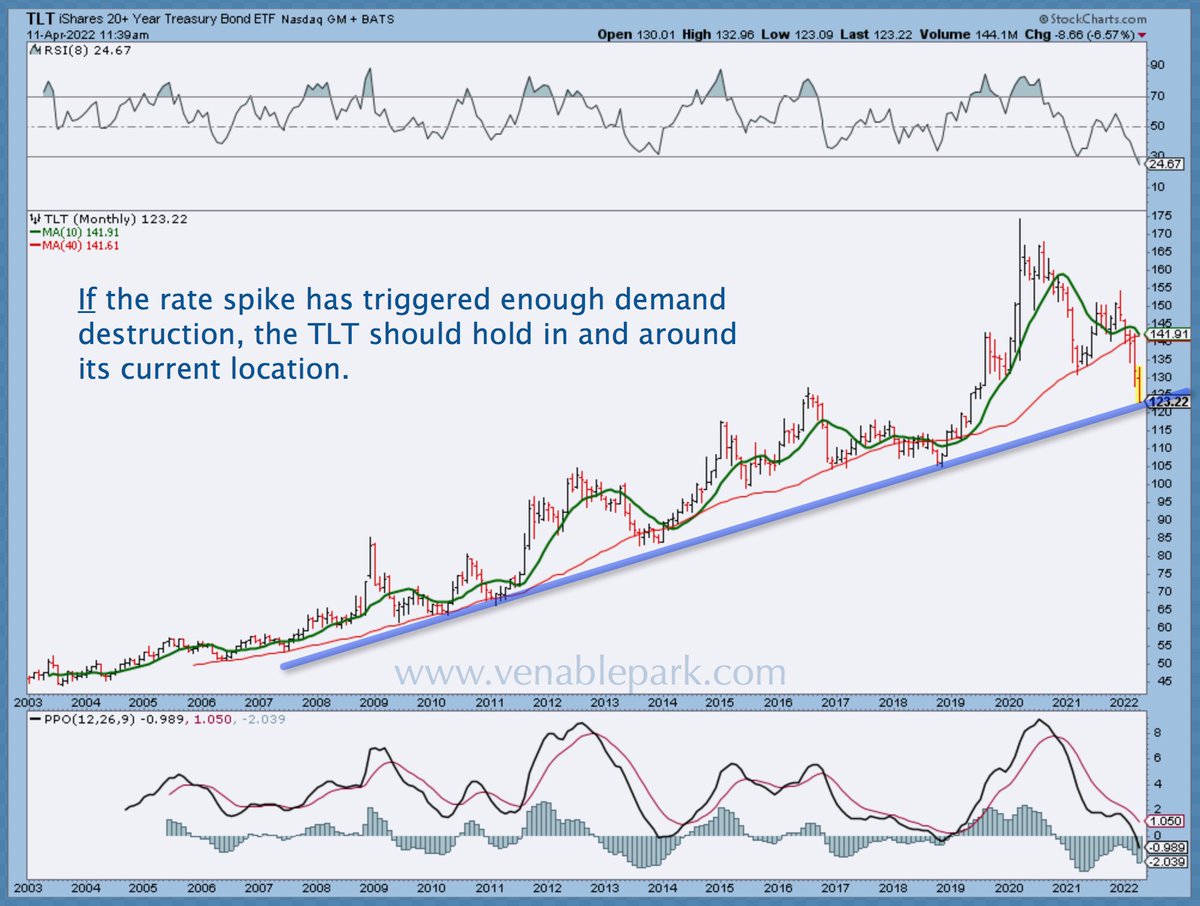
As shown below by my partner Cory Venable, the 20-year US Treasury Bond ETF (TLT) has fallen 28% from its high in August 2020–the most in more than 20 years–and is today testing the trend line has held since the 2008 recession. A whole lot of inflation expectations have been priced into bonds here. This increases the odds of reprisal should consumption weaken and excess inventories build.
It’s illuminating to note that the S&P 500 materials sector is no higher today than in mid-November for all the inflationary forecasts.
TODAY, the US dollar index (DXY) touched 100–its highest since March 2020. A higher US dollar is deflationary for US imports and commodities while demand-destroying for a world servicing US dollar-denominated debt. Oil (WTI) is off 26% from its recent high on March 8. Fossil fuel company shares and financials/banks typically follow in late-cycle declines.
Fast price moves tend to break things, especially when market participants are highly leveraged, and long-duration assets are most sensitive to the rate of change.
Equities have a virtually infinite duration (no maturity dates), so it’s not surprising that the average stock is down significantly. This is especially true in the most rate-sensitive areas. Here’s some of the downside progress from key sectors as of Friday’s close:
- Auto parts: –36%
- Consumer electronics: –36%
- Homebuilders: –33%
- Airlines: –32%
- Trucking: –24%
- Asset managers: –21%
- US Banks: –19%, Canadian financials (XFN) -7%
- Russell 2000: –18%
- Retailers: –16%
- Transports: –15%
- Consumer services: –14%
- Rails: –11%
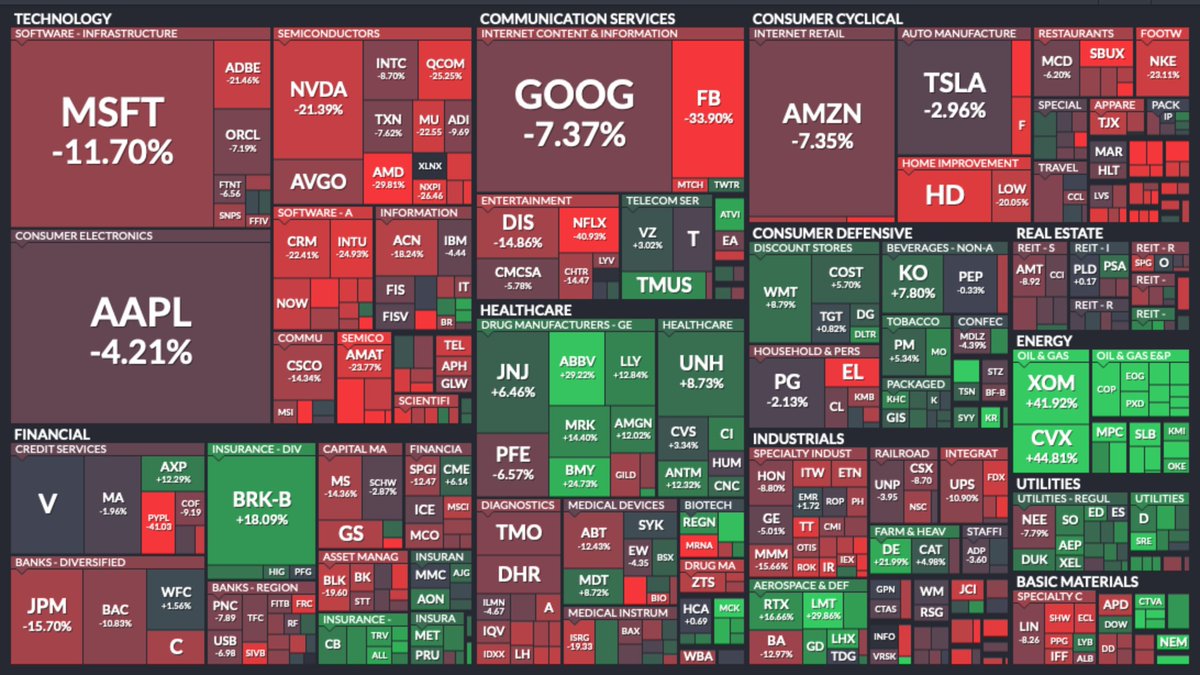
This Treemap of S&P 500 component returns year-to-date shows individual losses in red (from Markets and Mayhem) and the fewer winners (so far) in green.
Mean reversion is the law of market cycles, and the higher the starting valuation, the deeper the bear market to follow.
The ten most expensive S&P 500 stocks—Apple, Microsoft, Amazon, Tesla, Alphabet, Berkshire Hathaway, NIVIDIA, United Health and Meta–accounted for 30.7% of the index market cap at the end of last month. This was the highest concentration in history, and above the 27% peak of the 2000 tech bubble, before the most loved names tumbled by more than 50%.
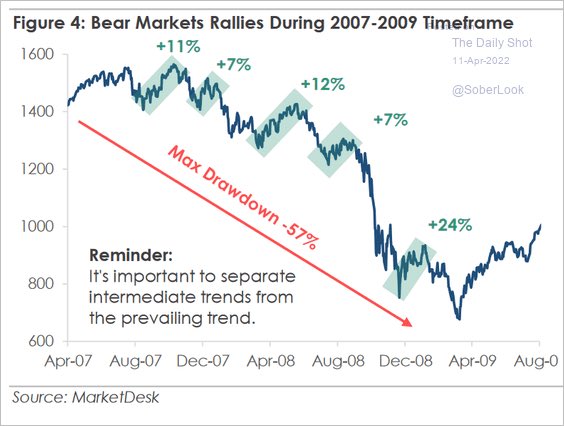
Bears move in a series of down legs interspersed with dramatic rebounds to suck in dip buyers all the way down. This chart below of price action during the 2007-09 bear market offers a visual to help train mental strength and discipline. The 10.5% bounce in the S&P 500 from March 14 to March 29 was typical, and it’s over. The next leg down is in motion.