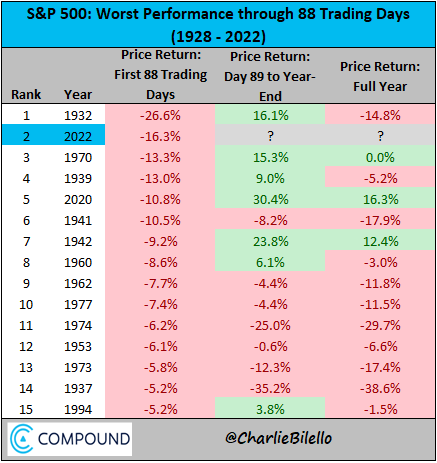
As of yesterday, the 27% year-to-date drop in both the tech-heavy Nasdaq and smaller-cap Russell 2000 is the worst start to a year on record. As shown in the table below, courtesy of Charlie Bilello, the broader-based S&P 500 is -17% from its January 4th high and -16% year-to-date–its second-most negative start to any year since 1932. As the table shows, prices rebounded into year-end in 7 of the 15 worst annual starts. In eight, they continued to decline.
While 2020 is one of the years where stocks recovered after an initial decline, it’s worth noting that it took zero-interest policy rates, payment deferrals for the masses and trillions of fiscal and monetary support globally. The US government alone spent a record 43.2% of GDP on stimulus efforts in 2020 and 2021. In 2022, these extraordinary efforts are all in reverse.
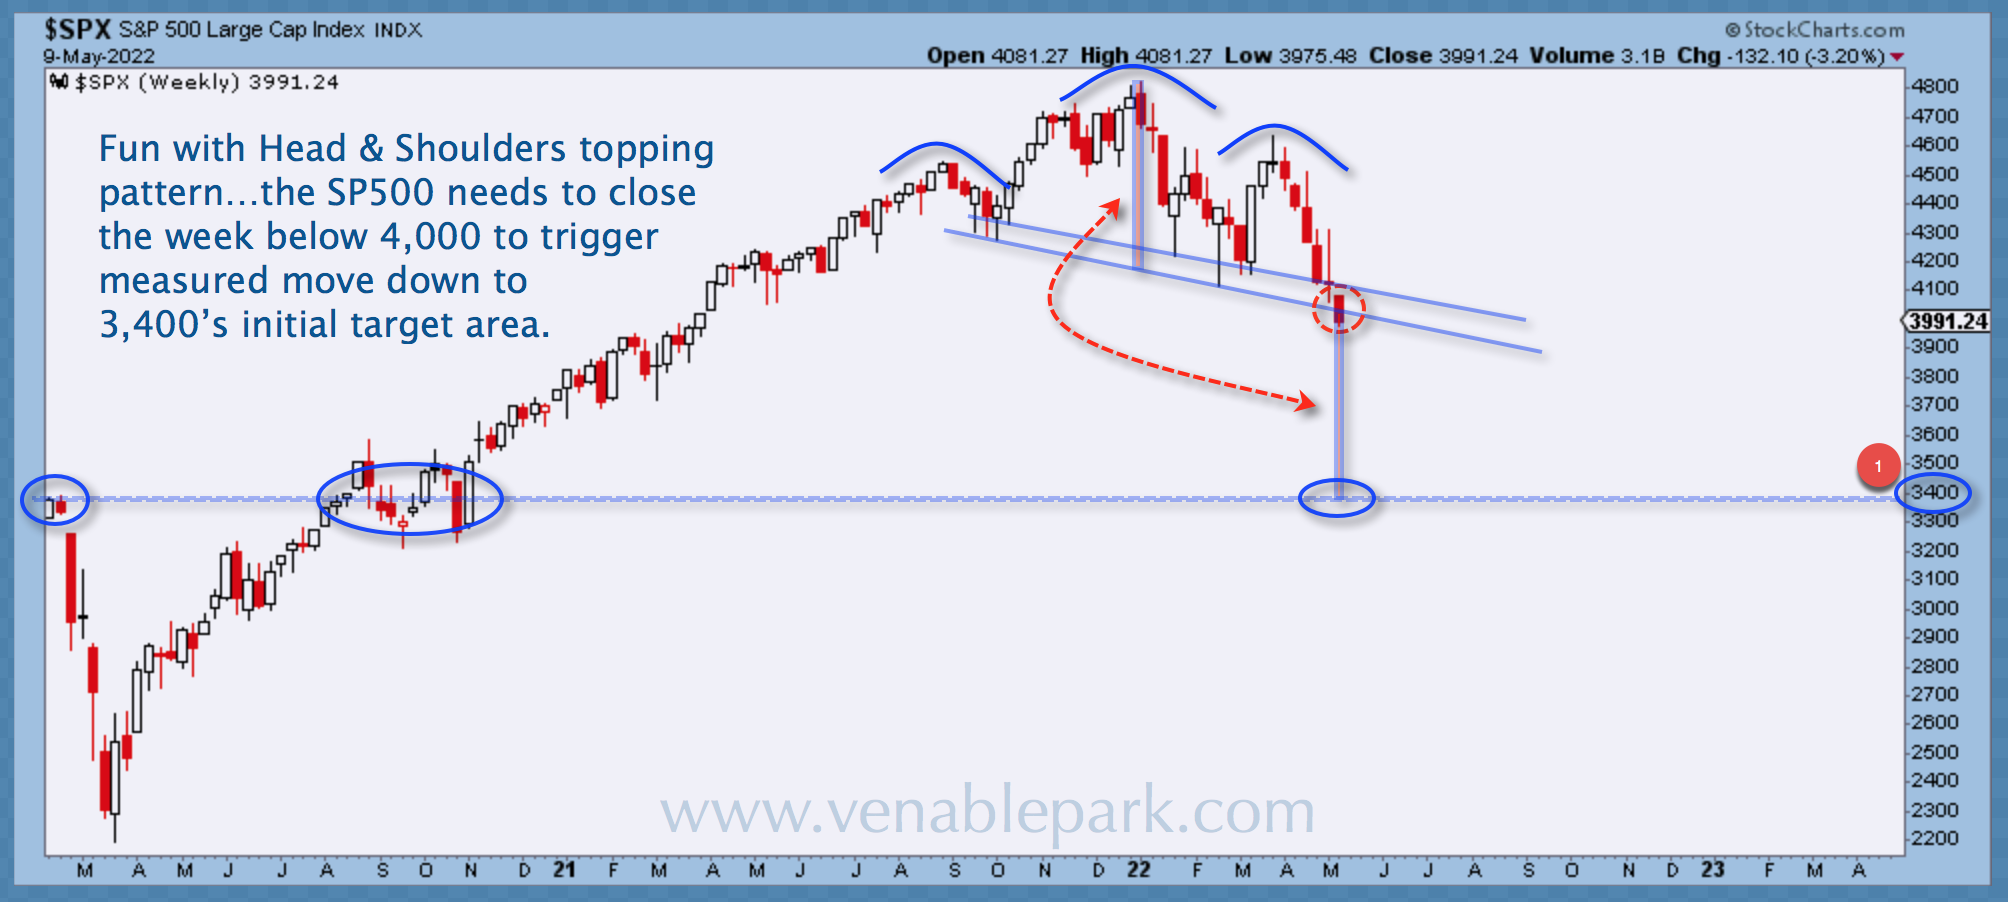
On Monday, the S&P 500 broke below 4000 on the daily close. As shown below from my partner Cory Venable, a weekly close below 4000 would suggest that 3400 (-15% from here) is next up for restest.
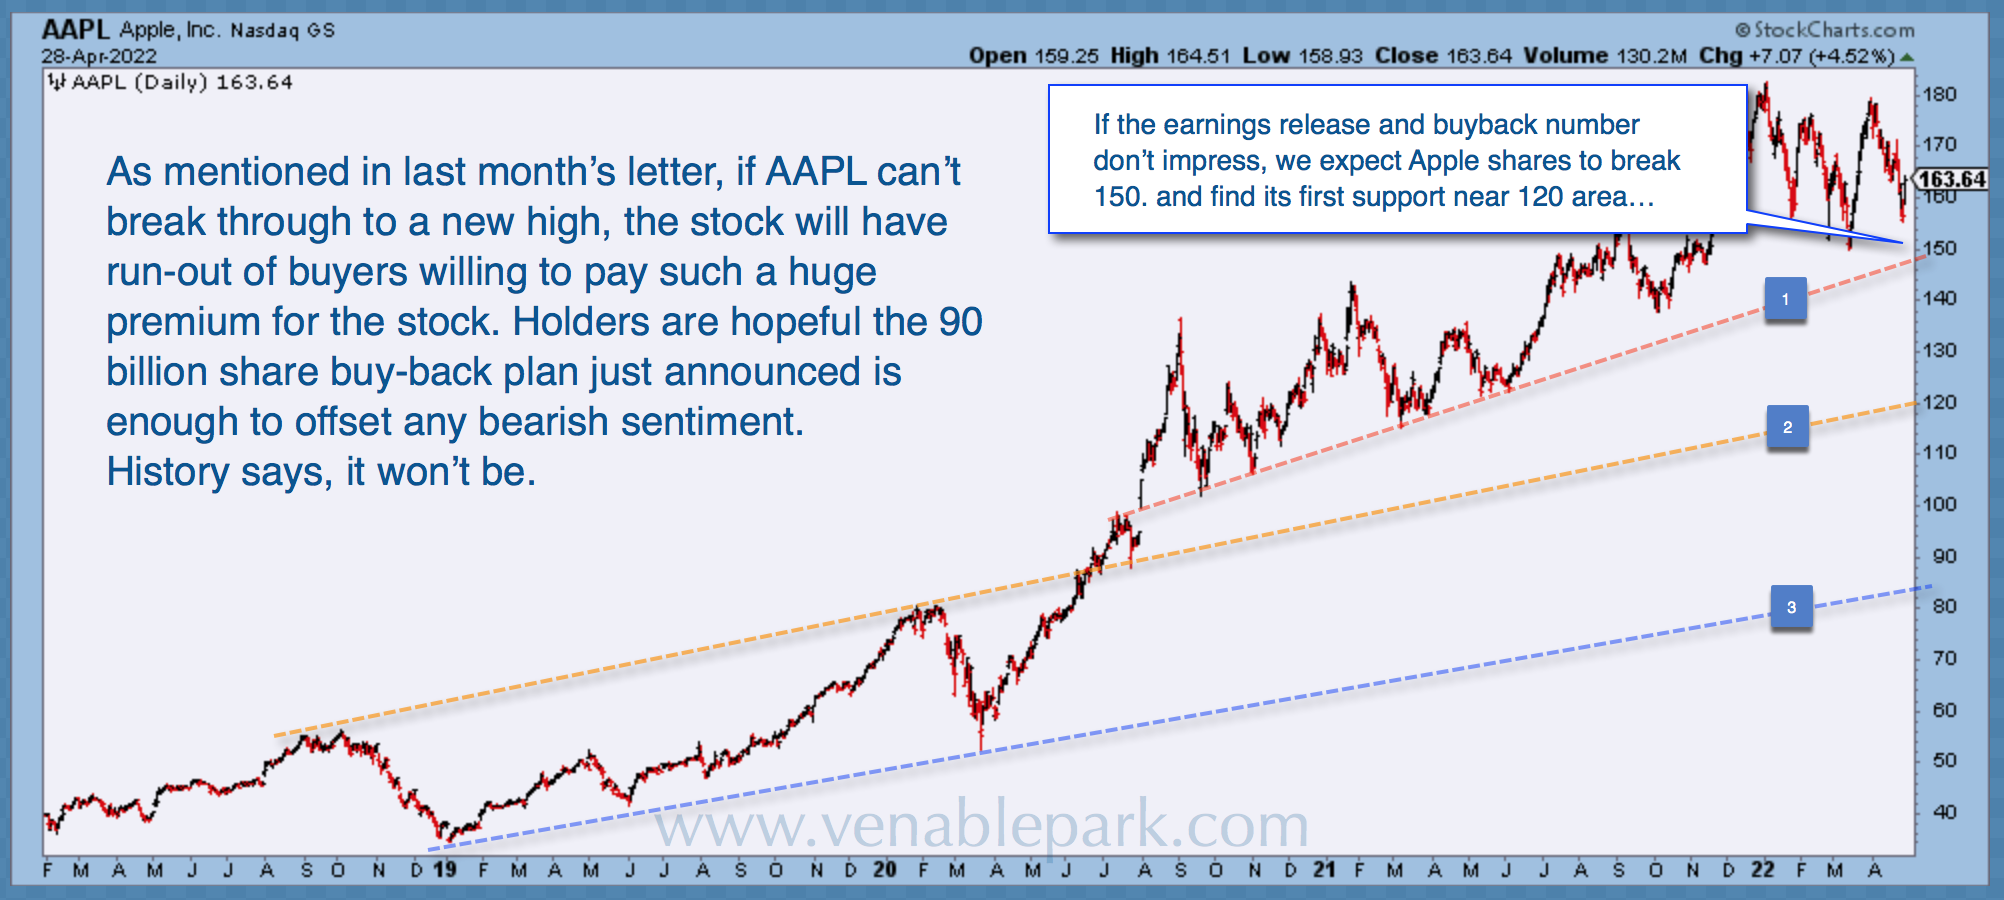
So far, the largest market cap weight and most widely held stock, Apple, is off just 17% from its $185 top on January 3, 2022. When Apple breaks $150 (as noted in Cory’s April 29 chart below), further downside tests await at the $120 and $85 support levels. Comprising 7% of the S&P 500 market cap, the breakdown in Apple will hit index-tracking funds and portfolios everywhere.
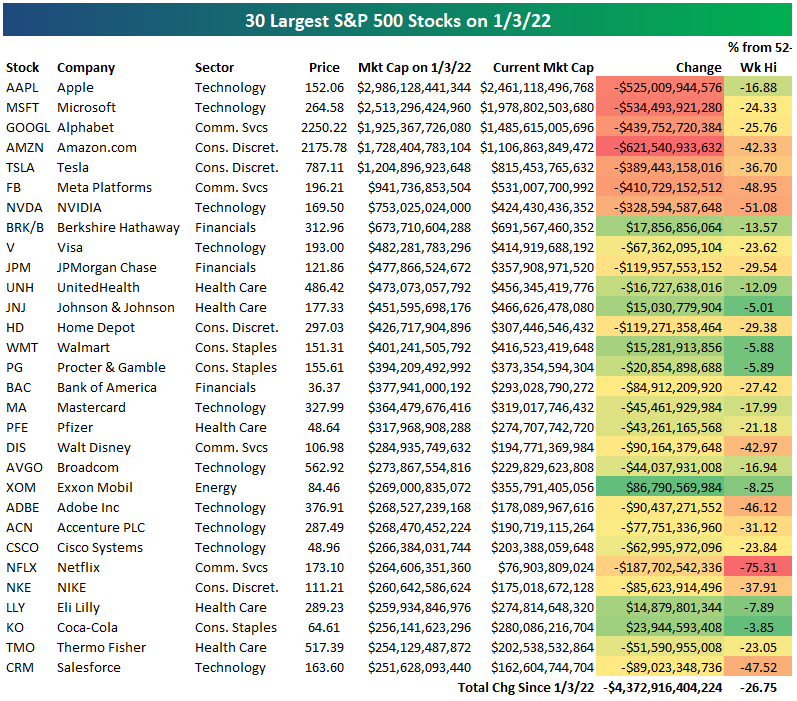
Below is the bear market progress of the thirty most expensive S&P 500 market cap companies so far, courtesy of Bespoke. Coming down nicely…